AI/BI Dashboards
Recent items mentioning AI/BI Dashboards across the Databricks ecosystem — releases, news, videos, and community Q&A. Updated hourly.
Databricks AI/BI Dashboards are rapidly evolving, with recent updates including the General Availability of native map rendering for geospatial data via Spatial SQL 4. Genie Code Skills can now automatically generate production-ready AI/BI dashboards from business prompts, enforcing engineering standards like dimensional modeling and automated refresh jobs 2. Community discussions highlight advanced features like nested tabs and reusable visuals 3, as well as security considerations for limiting sharing to workspace members 1.
Generated daily from the 6 most recent items mentioning AI/BI Dashboards. Click any [N] to jump to the source.
How to limit the AI/BI dashboard sharing people-picker to workspace members
 News
NewsGenie Code Skills: Maintaining Quality at Scale
Genie Code can automatically generate a Databricks AI/BI dashboard from a simple business prompt, performing data discovery and dashboard authoring. By adding a "skill" to Genie Code, users can enforce engineering standards like bronze, silver, and gold table creation, dimensional modeling, and automated refresh jobs, making the output production-ready and repeatable.
AI/BI Dashboard Navigation: Nested Tabs, Page Structure, and Reusable Visuals
Geospatial Unbounded: Spatial SQL GA with AI/BI Maps, Delta Sharing, and Iceberg v3
Spatial SQL is now Generally Available on Databricks, bringing native geospatial data types, 90+ ST_* functions, and AI/BI Dashboards that render maps natively. This release also includes major performance improvements, open lakehouse support via Delta Sharing and Iceberg v3, and Apache Spark 4.2 compatibility for geo columns.
Metric Views in AI/BI Dashboards & Genie (Part 2 of 3)
I Finally Get Why Everyone's Excited About Databricks AI/BI Dashboards
The SDK now supports more granular AI agent detection in User-Agent headers and passes unrecognized values as-is. Several API changes introduce new fields for dashboards, apps, ML materialized features, and synced table statuses, along with a `Revert` method for Lakeview dashboards.
This release introduces new methods for Lakeview and Postgres services, including `revert()` for Lakeview and `undeleteBranch()` for Postgres, along with new fields across various services like Jobs and IAM. Several breaking changes require `actionType` and `resourceId` for bundle operations, `cliVersion` for bundle versions, and alter the `tags` field for Marketplace listings and pagination for cluster events.
This release introduces a new Databricks Asset Bundles service and adds `revert()` to Lakeview dashboards and `undelete_branch()` to Postgres. It also includes breaking changes to the `tags` field in Marketplace listings and pagination for Cluster events.
 News
NewsApache Iceberg V3 on Databricks: From Ingestion to Analytics
The video demonstrates Apache Iceberg v3 on Databricks, showcasing how its new variant column type natively handles semi-structured data and how row-level concurrency enables simultaneous data ingestion and corrections. It also highlights cross-platform data accessibility from open-source Spark via the Iceberg REST catalog, ensuring no vendor lock-in.
The question your commercial data should already be able to answer
Databricks and Veeva now embed Genie AI agents and AI/BI dashboards directly into Veeva Vault CRM, enabling life sciences commercial teams to get real-time answers to their questions without leaving their workflow. This unified Databricks lakehouse with Unity Catalog delivers governed commercial data to every persona, from sales reps to MSLs, in the format and depth their role requires.
 News
NewsStop Guessing Table Health — Let These Dashboards Tell You
Databricks offers two dashboards for monitoring table health and access: the Table Access Advisor and the Table Health Advisor. These dashboards provide insights into table ownership, read/write patterns, staleness, optimization status, and underlying file structures, helping users identify ghost tables and ensure best practices.
 Tutorials
From Excel to AI Agents: The Evolution of BI Explained
The video explains the evolution of Business Intelligence (BI) through four phases, from IT-centric to analyst-driven, then semantic layers, and finally to a future where AI agents are primary BI users. It demonstrates how Databricks' BI stack, including Dashboards, Genie (natural language interface), Metric Views (semantic layer), and Databricks One (serving layer), addresses these evolving needs by providing a unified, open, and AI-ready platform.
 News
NewsNever Build a Dashboard by Hand Again
The Databricks assistant, now called Genie code, can automatically generate multi-page dashboards from a blank canvas using natural language prompts. Users define a metric view as the data source and then describe desired dashboard pages, visuals, and themes, with Genie code planning and executing the build.
 Tutorials
Databricks AI Dev Kit Demo - Install, DataGen, SDP, Dashboard
The video demonstrates installing the Databricks AI Dev Kit on a Mac, then uses it to generate synthetic data, create serverless Spark declarative pipelines for a medallion architecture, and build a Databricks dashboard based on the generated data. It highlights how the AI Dev Kit leverages skills and an MCP server to automate these development tasks.
This release introduces new resources for managing Postgres databases, data classification catalog configurations, and knowledge assistant features. It also renames the `databricks_apps_space` resource to `databricks_app_space`.
 Tutorials
Databricks End-To-End Project | Zero-To-Expert | Streaming, AI, Lakeflow, Unity Catalog, AI/BI
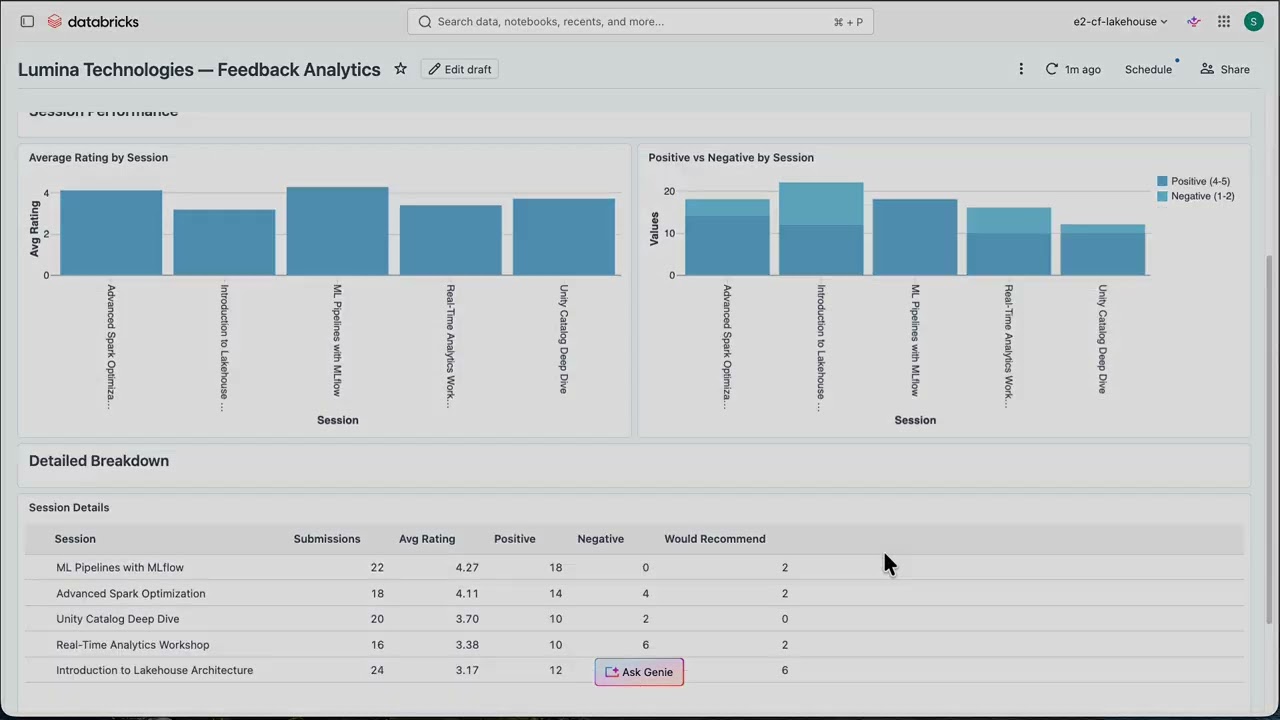
This video demonstrates building an end-to-end restaurant analytics platform on Databricks, covering streaming and batch data ingestion, AI-powered sentiment analysis, and dashboard creation. It teaches how to use Unity Catalog, Lake Flow Connect for CDC, Spark declarative pipelines for real-time data from Event Hub, and how to construct a medallion architecture with fact and dimension tables.
 Tutorials
Unity Catalog Metric Views - Why you should care about Databricks' new Semantic Models
Unity Catalog Metric Views are Databricks' new semantic models, allowing users to define business-friendly names, dimensions, and context-sensitive measures for data. These views centralize KPI definitions, enabling consistent use across dashboards, AI tools, and downstream BI platforms, and are created using YAML.
You can now force a rerun of an assessment to get new results, even if it was previously run. Dashboard management is more robust, automatically creating a new dashboard if a PermissionDenied exception occurs or if the existing one is invalid.
 Tutorials
46 AIBI Dashboards & Visualizations | Consumer Access in Databricks | Forecasting Reports
 Tutorials
Healthcare Interoperability: End-to-End Streaming FHIR Pipelines With Databricks & Redox

You can now create account-level groups from nested workspace-local groups and install UCX in offline environments. The UI for tables and compute summaries now includes clickable hyperlinks for easier navigation.
UCX now supports Databricks Runtime 16+ for Hive Metastore table conversions and introduces a new `query_statement_disposition` option for SQL backend exports to handle large workspaces. Pipeline and dashboard migration workflows have been enhanced with new filtering options and improved progress tracking, including daily scheduled migration progress updates.