46 AIBI Dashboards & Visualizations | Consumer Access in Databricks | Forecasting Reports
Description
Azure Databricks | AIBI Dashboards | Consumer Access in Databricks Video explains - What is AIBI Dashboards in Databricks? How to use Metric Views in AIBI Dashboards? How to use text Prompts in AIBI Dashboards? How to setup consumer access in Databricks? How to setup Databricks One Consumer Access? How to create Visualization in AIBI Dashboards? How to create Forecasting reports in AIBI Dashboards? How to share AIBI Dashboards in Databricks? Chapters 00:00 - Introduction 01:31 - How to create AI/BI Dashboards in Databricks? 02:42 - Add datasets for Dashboars 04:40 - Create Visualization in Dashboard 09:48 - How to create Custom Calculated columns in Dashboars in Databricks? 13:49 - Adding Filters in Dashboard 19:29 - Using AI prompts to generate Visualizations 20:37 - How to add comments in tables for AI dashboards to work? 22:00 - Using Metric Views for Dashboards 26:39 - Publish Dashboards for Consumption 28:20 - Forecasting data using AI/BI dashboards 30:52 - How to configure Consumer access for Business Users? Databricks Website: www.databricks.com Databricks Metric Views - https://learn.microsoft.com/en-us/azure/databricks/metric-views/create Data Warehousing Playlist - h…
Description from YouTube. Full content on the video page.
More from Ease With Data

 Tutorials
✅ How Transformers Work - Attention Explained Step by Step | Chapter 06
The video explains the Transformer architecture, detailing how it processes text input through tokenization, embedding, and a stack of Transformer blocks to generate the next token. It breaks down the attention mechanism, multi-head attention, and feed-forward layers within a Transformer block, highlighting the differences between encoders and decoders.
 News
NewsHow LLMs Understand your Prompts: Tokenization & Embeddings | Chapter 05
The video explains how Large Language Models (LLMs) understand text by converting it into numerical representations through tokenization and embeddings. It demonstrates how text is broken into tokens, assigned unique IDs, and then transformed into dense vectors (embeddings) that capture semantic meaning and positional information for LLM processing.
 Tutorials
How Large Language Models (LLMs) Work - Full Explanation | Chapter 04
Large Language Models (LLMs) are text-based neural networks trained on massive data to predict the next word (token), operating through tokenization, vector embeddings, and a transformer architecture. LLMs undergo pre-training, supervised fine-tuning, and reinforcement learning from human feedback to become helpful, safe, and aligned, with concepts like context length, knowledge cut-off, and hallucination defining their capabilities and limitations.
 News
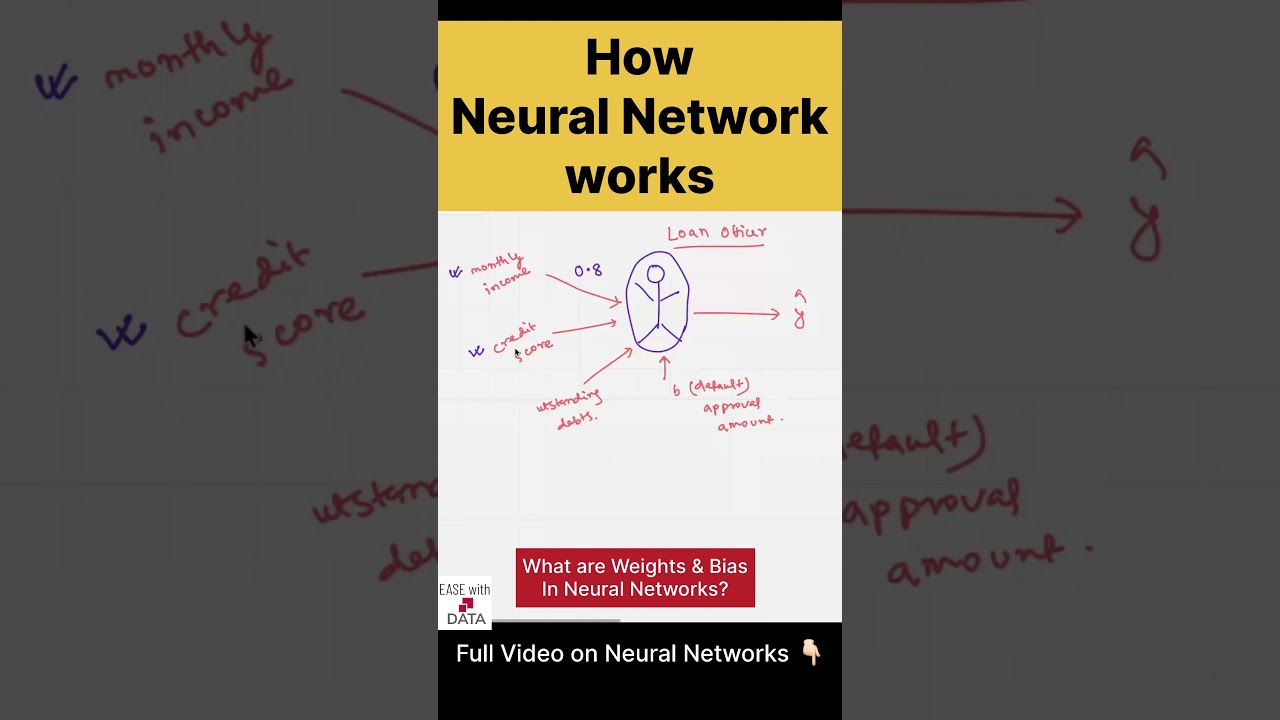
NewsHow Neural Network works | Weights and Bias #dataengineering #neuralnetworks #genai
A neural network's neuron processes input signals by assigning weights to each, reflecting its importance (e.g., monthly income has a high positive weight, outstanding debts a negative weight). These weighted inputs are summed with a bias, and the result is passed through an activation function to produce an output decision.
 Tutorials
Neural Networks Explained - How They Work & Are Trained | Chapter 03
This video explains how artificial neural networks (ANNs) work, detailing the components of a neuron (inputs, weights, bias, activation function) and how they form layers in a network. It also covers the training process, including forward propagation, loss calculation, and backpropagation using gradient descent to adjust weights and biases.