
Databricks SQL
Recent items mentioning Databricks SQL across the Databricks ecosystem — releases, news, videos, and community Q&A. Updated hourly.
What is Databricks SQL?
Databricks SQL is the data warehouse side of the platform. It runs directly on your data lake and supports ANSI SQL with Delta Lake extensions, so you get warehouse-style SQL over the tables you already have instead of loading copies into a separate system. Queries run on SQL warehouses, compute dedicated to SQL workloads.
It carries the tooling analysts expect: a SQL editor with AI assistance and version history, AI/BI dashboards, alerts that monitor query results and deliver notifications, and a metrics layer for defining business metrics with consistent calculations. It also covers a fair amount of ETL, since streaming tables and materialized views can be defined and refreshed directly in Databricks SQL and queries can be scheduled as jobs.
SQL warehouses come in serverless, pro, and classic types, and Databricks recommends serverless when available: capacity management, patching, upgrades, and performance optimization are handled by Databricks. Query history, execution plan inspection, and automatic recommendations for inefficient queries are built in.
What's the difference between serverless, pro, and classic SQL warehouses?
All three run Databricks SQL queries. Databricks recommends serverless SQL warehouses when available, citing instant and elastic compute, minimal management overhead, and lower total cost of ownership, since capacity management, patching, upgrades, and performance optimization are handled by Databricks. Pro and classic remain as alternatives where serverless isn't offered.
Can I use Databricks SQL for ETL, not just BI queries?
Yes. You can define and refresh streaming tables and materialized views directly in Databricks SQL, and schedule SQL queries as jobs for automated data processing and reporting workflows.
Do I need to move my data into Databricks SQL first?
No. Databricks SQL is built on lakehouse architecture and runs directly on your data lake with ANSI SQL and Delta Lake extensions, so the warehouse sits on data where it already lives rather than on copies loaded into a separate system.
Does Databricks SQL include dashboards and alerts?
Yes. AI/BI dashboards with AI-assisted authoring are built in, and alerts can monitor query results, evaluate conditions, and deliver notifications automatically. There's also a metrics layer for defining business metrics with consistent calculations.
Sources: Databricks SQL overview (Databricks docs) · SQL warehouses (Databricks docs)
Databricks made system.query.history generally available 1 and added the counter_diff window function to Databricks SQL 3. For workload management and tooling, teams can now deploy automated cost-spike alerts against SQL warehouses using AI_FORECAST on system tables 4, while dbt-databricks v1.12.5 introduced proper log interpolation for Databricks SQL queries and a safer backup-and-create strategy for metric views 10.
Generated daily from the 10 most recent items mentioning Databricks SQL. Click any [N] to jump to the source.
system.query.history is now Generally Available in Databricks
Until now, answering "which query is eating our warehouse?" or "who changed that table?" meant clicking through the Query History UI one workspace at a time. Now it is a SELECT. The table logs every statement run on SQL warehouses, serverless compute, and Lakeflow pipelines, across all workspaces in the same region. Read more on LinkedIn: https://www.linkedin.com/posts/cenh_databricks-dataengineering-systemtables-ugcPost-7511094425977016320-L7uj/?utm_source=share&utm_medium=member_desktop&rcm=ACoAABmJHrsBNAC3x3H1M58JRKoHv_l4D61n0-8 submitted by /u/Lenkz [link] [comments]
Laya off the benchmark: can a zero-shot decision model route real SQL traffic?
Weekend-ish experiment on Databricks. One table, TPC-H orders, 15M rows, living in two places at once: Lakebase (Databricks' managed Postgres), a continuously synced copy with a btree index on the key. Sub-100ms point lookups, useless for a GROUP BY over 15M rows. Delta behind a serverless SQL Warehouse. Great at scans and aggregations, slow at fetching one row. The synced table is the nice part: native continuous Delta to Lakebase Postgres (needs a PK + CDF), so it's one dataset under one Unity Catalog, replication handled by the platform instead of a homemade pipeline. Then I put laya (convaiinnovations/laya, a non-autoregressive zero-shot decision model, vanilla, no fine-tuning) behind a FastAPI Databricks App. It reads each query and picks the engine. MLflow traces input to decision to execution. I submitted by /u/Limp-Park7849 [link] [comments]
New Databricks SQL window fuction: counter_diff
Top 5 System Table Queries for Understanding Your Databricks Costs
Five targeted system table queries deliver near-real-time visibility into your Databricks spend broken down by product, SQL warehouse, and team. Deploy them to flag cost spikes against a rolling 14-day baseline with DBSQL alerts and project 30-day expenditures in a single query using AI_FORECAST.
What if Databricks showed the cost directly next to every job and run?
Databricks give us a lot of cost data, but usually not where we actually need it. When I open a job run, I can see duration, compute, tasks and logs, but not what that run actually costs. When I create a cluster or SQL warehouse, I choose the size first and DBU, and discover the real cost later. That’s the problem we’re trying to solve, bringing cost directly into the Databricks UI. We created a free browser extension, with no backend or telemetry https://finopsway.com/ submitted by /u/Significant-Guest-14 [link] [comments]
Before you move a job to serverless: the limitation list is the real decision, not the startup time
Most classic-vs-serverless comparisons stop at "serverless starts faster and Databricks manages it". True, but that is not what decides it in practice. Where they differ structurally: with classic compute the control plane asks your cloud provider for VMs, and the cluster runs in your own account and network, so you pick instance types and own the networking, and you pay the cloud provider for machines plus Databricks for DBUs. With serverless, the docs say resources run in "the serverless compute plane, which is managed by Databricks" and you provision nothing in your own cloud account. Your tables stay in your own storage in both cases. What actually decides it is the limitation list: - R is not supported - compute-scoped libraries and compute-scoped init scripts are not supported - only Spark Connect APIs are available, so the Spark RDD APIs are out - streaming: Trigger.AvailableNow() is supported, Trigger.Continuous(interval) and Trigger.ProcessingTime(interval) are not - maximum runtime is 7 days; a run that exceeds it is terminated and not retried So: serverless for SQL warehouses, ad hoc exploration and spiky jobs where waiting for a cluster is the real cost. Classic when you need a specific instance type or GPUs, cluster-scoped libraries, R, RDD code, a continuous stream, or your own network setup. I drew both paths side by side as a short animated diagram (2:36): https://youtu.be/s8452E2Y6WM Series in order: https://www.youtube.com/watch?v=B5iHmoYgnqY&list=PLDB5WDkDOYF4 For those who have moved production jobs across: what caught you out that is not on the documented list? submitted by /u/Broad-Cherry-5999 [link] [comments]
Databricks pipeline works in one workspace but fails in another — where would you start?
Imagine the same pipeline and code are deployed to two Databricks workspaces. Workspace A: catalog.schema.table → Query works → Pipeline works Workspace B: catalog.schema.table → Catalog not accessible → Pipeline fails The catalog exists, the table exists, and the SQL itself is valid. Would you first investigate: Workspace-to-catalog assignment Unity Catalog permissions USE CATALOG USE SCHEMA SELECT privileges Service principal permissions External locations Storage credentials Cluster access mode SQL Warehouse identity I'm curious about the actual troubleshooting order people follow for these kinds of Unity Catalog issues. What would you check first? submitted by /u/hanshu6576 [link] [comments]
Manager wants us to "use AI." Thinking about an AI-driven data testing framework for DevOps promotions. Sanity check?
Although we are using genie code alot but manager wants some functionality based on AI. ( maybe that’s hood goal). Our devs hate manually writing tests, so I'm drafting an automated testing gate for DevOps promotions (Local ➔ Dev ➔ QA). Wanted review with all of you. The Proposed Architecture: 1. Extract Metadata: Pull column tags, schemas, and lineage from Databricks Unity Catalog. 2. AI-Generated Tests (Llama via ai_query ): LLM reads metadata to draft SQL data checks (nulls, types, basic business logic). 3. Persist & Cache: Save SQL rules to a table. Re-generate only when schema hashes change so bug-fix retests stay 100% deterministic. 4. Execution: Run the generated SQL on a SQL Warehouse (fast, cheap, no LLM cost per data row). 5. Alerting: Feed error logs to LLM for a 2-sentence summary and send directly to Teams via Webhook (avoiding ignored email reports). How does it sound like? Is it really worth it? Anybody using this or any other AI based functionality to make devs life easy. submitted by /u/Terrible_Mud5318 [link] [comments]
How do you parse an xml that's in string format?
I have xml data that's for God knows why it's in string format. And the fking thing is so messed up or at least I think it's messed up because it's not consistent. Sometimes there is something else in there. Xml is something like this: .... ... ... Regex is not an option. Substring is not an option. Because it's so messed up it's not consistent. I just need to somehow parse and get that Name, Age, Gender values using Sql/Databricks sql Please, help you mate. submitted by /u/pineapple_brownies [link] [comments]
No more UNION ALL-ing all of your SDP pipeline event log tables for monitoring
https://preview.redd.it/3w0j4ss3inoh1.jpg?width=2048&format=pjpg&auto=webp&s=50bc79280a546544e8f795947e5af6b211e9596a Hi folks, Databricks PM here - I wanted to share an exciting update that you no longer have to manually publish and combine your pipeline event logs for monitoring across pipelines and workspaces. We just launched the beta for the pipeline events system table (system.lakeflow_pipeline_events_preview.pipeline_events). Key features: All pipeline events (regardless of cluster start) are automatically captured without any manual enablement or maintenance. Events are aggregated in a central system table without requiring any custom aggregation logic. This data is available at close to real time latency (based on our internal testing we achieve a P99 latency of less than 1 minute). An admin can grant a single user access and they can query events for every pipeline in the table. Fine-grained access controls support which scopes the visibility to only the pipelines the user has access to is coming soon. The data remains in the system table even after pipeline deletion and is retained for 13 months. If you want longer retention this is also possible with the configurable retention feature for System Tables. Query ergonomics are better now with the use of VARIANT. Here are some sample queries in case you want to try them out: -- The latest error for each pipeline that has errored in the last 7 days, with the outermost exception. -- The exception chain is ordered with the root cause last, so read element -1 for the root cause. -- On many errors only the first element carries error_class and sql_state. SELECT workspace_id, pipeline_id, event_time, event_type, message, error.exceptions[0].error_class AS exception_error_class, error.exceptions[0].sql_state AS exception_sql_state FROM system.lakeflow_pipeline_events_preview.pipeline_events WHERE level = 'ERROR' AND event_time >= current_timestamp() - INTERVAL 7 DAYS QUALIFY ROW_NUMBER() OVER (PARTITION BY workspace_id, pipeline_id ORDER BY event_time DESC) = 1 ORDER BY event_time DESC -- Flow throughput for a specific pipeline SELECT origin.flow_name, date_trunc('HOUR', event_time) AS hour, SUM(variant_get(details, '$.flow_progress.metrics.num_output_rows', 'BIGINT')) AS rows_written FROM system.lakeflow_pipeline_events_preview.pipeline_events WHERE pipeline_id = ' ' AND event_type = 'flow_progress' AND event_time >= current_timestamp() - INTERVAL 7 DAYS GROUP BY origin.flow_name, date_trunc('HOUR', event_time) ORDER BY hour DESC, rows_written DESC -- Data quality: failed expectations by dataset, per update, in the last 1 day SELECT pipeline_id, update_id, origin.dataset_name, expectation.name AS expectation_name, SUM(expectation.failed_records) AS failed_records FROM system.lakeflow_pipeline_events_preview.pipeline_events LATERAL VIEW explode(variant_get(details, '$.flow_progress.data_quality.expectations', 'ARRAY >')) AS expectation WHERE event_type = 'flow_progress' AND event_time >= current_timestamp() - INTERVAL 1 DAY GROUP BY pipeline_id, update_id, origin.dataset_name, expectation.name HAVING SUM(expectation.failed_records) > 0 ORDER BY failed_records DESC; Beyond single queries you can build alerting (using Databricks SQL alerts) and dashboards. We will share a new dashboard template soon - I will update this post once its available. Call outs: This is in beta right now, if you are not opted in we will not capture your event log data. Enablement: Toggle on the “ Lakeflow Pipeline Events System Table ” from the account level preview. Docs are linked here , would love to hear your thoughts on how you will use it or what else you want to see to improve observability! submitted by /u/brickster_123 [link] [comments]
Databricks is too expensive for small teams" is usually a workload problem, not a platform problem
Every few weeks someone posts a version of “our bill is going from $1k to $5k a month, is Databricks even worth it at our size?” The answer isn’t really about company size. It comes down to how you’re using the platform. All-purpose compute being used for scheduled jobs. Interactive clusters are convenient, but they can increase costs quickly. If a notebook runs on a schedule, moving it to jobs compute can make more sense. SQL warehouses sized for peak usage and left running. Using auto-stop and choosing a warehouse that can scale when needed can help avoid paying for idle capacity. Continuous triggers on jobs that don’t need them. This one gets misdiagnosed a lot. The fix usually isn’t “rewrite it as batch,” which costs you checkpointing and exactly-once. It’s Trigger.AvailableNow , which processes what’s available and shuts the cluster down. Databricks recommends it for incremental batch processing. If the table needs a 15-minute refresh, that’s a scheduled job with an AvailableNow trigger, not a cluster running at 3 AM. Once these three areas are addressed, the bill for a small team can often come down to a much more reasonable baseline. Then the more interesting question is: are you actually getting value from Unity Catalog, Delta, and the broader BI, ETL, and ML capabilities, or are you mainly paying for Spark compute that you don’t really need? If your data fits comfortably in Postgres or ADX, you have one main consumer, and you don’t need much governance or lineage, Databricks may not be necessary. No amount of cost tuning changes that. For teams running Databricks on relatively small workloads, what actually made it worthwhile for you? Was it a specific technical requirement, governance, or simply the convenience of having everything in one platform? submitted by /u/AbilyticsEng [link] [comments]
Do small companies actually use Databricks?
Sometimes I feel like Databricks is way too expensive. It feels like using a huge truck to move a single grain of sand. My company needs real-time data, but our data volume simply does not justify the use of Spark Structured Streaming. Despite this, they are insisting we move to Databricks. I'm worried our data infrastructure costs will jump from $1,000/month to $5,000/month or more due to the running costs of Databricks SQL Warehouses. Currently, I use Azure Container Apps with KEDA and Python, which helps me manage scaling and keep costs low. We ingest into Event Hubs, use ADX (Azure Data Explorer) as our OLAP warehouse, and archive cold data in a data lake. With this setup, I manage to process all our data with very low latency. When I tested this on Databricks Structured Streaming, I actually got higher latency and much higher costs. Would love to know what you guys think. submitted by /u/Puzzled-Mail-9092 [link] [comments]
What is a Warehouse in Databricks SQL?
Query works in Databricks SQL but fails through JDBC
I’ve noticed cases where a query runs successfully in the Databricks SQL editor but fails when the exact same query is executed through a JDBC-based application or data quality tool. Has anyone run into this? Was the issue related to query wrapping, session settings, SQL dialect differences, or JDBC driver behavior? How do you usually troubleshoot these cases? submitted by /u/No_Ambition8323 [link] [comments]
Metric views now replace existing tables or views using a backup-and-create strategy rather than direct create-or-replace syntax. Lazily formatted Databricks SQL log records are also now properly interpolated when mirrored into dbt logs.
What type of compute do you guys use in Databricks?
Hey everyone, I've been using Databricks for a while, but I'm still curious about how other teams decide which compute option yo use. There are so many choices now - serverless,job clusters, all-purpose clusters, SQL warehouses, etc. - and sometimes it's not really obvious which one makes the most sense. And when do you go with serverless vs a normal cluster? I'm also wondering if people are mainly choosing based on cost, performance, startup time, or just what their team is already comfortable with. Would be interested to hear what you're using in your projects and what made you choose it. Especially if you've switched from one type of compute to another and noticed a real difference. submitted by /u/Delulu62134 [link] [comments]
Does Photon support CSV?
Ok so I know that the docs state that CSV is supported. But when trying to read a very standard CSV file I get poorer than expected performance and in the Spark UI I see that it's not using a Photon scan operator, just regular Scan CSV followed by a Row to Columnar conversion operator. https://preview.redd.it/1amu93oqqslh1.png?width=260&format=png&auto=webp&s=4ca1c1ffec6cb6f6cd484b4645b0b5d7c5f6be86 I'm not running anything complex: df = ( spark.read .format("csv") .option("header", "true") .schema(schema) .load(csv_path) ) df.write.mode("overwrite").saveAsTable("...") I also checked reading the same CSV and a difference CSV via DB SQL (using `COPY INTO`) and see low task time spent in Photon + a row to columnar operator. https://preview.redd.it/g1tlotk8rslh1.png?width=940&format=png&auto=webp&s=f3d2b22ebab4f716c5b6831d96305c082e1126a8 DBR 19 + Serverless SQL Warehouse (current) Can anyone explain whether or not CSV is supported and in what conditions? This was quite a surprising find as I assumed that Photon supported pretty much everything. submitted by /u/Common_Jaguar474 [link] [comments]
Moving ~150 Tableau dashboards to Databricks AI/BI - anyone done this at scale?
We are considering moving from Tableau to Databricks AI/BI Dashboards and wanted to see if anyone here has made a similar move. We currently have around 150 Tableau dashboards used by 1,000+ users, with a mix of technical and non-technical users. Most of the underlying data already lives in Delta tables, so naturally we're looking at whether it makes sense to consolidate and use Databricks for the dashboarding layer as well. For those who have done this, how has the experience been? Anything you wish you knew before migrating? Any major limitations compared to Tableau, especially around visualization, performance, or the experience for non-technical users? I'm also curious about cost at scale. With 1,000+ users potentially hitting dashboards, did SQL warehouse usage become a concern? Would you feel comfortable replacing Tableau completely with AI/BI Dashboards today, or do you still find yourself needing Tableau for certain use cases? Would really appreciate hearing about real-world experiences. submitted by /u/Immediate_Bus5250 [link] [comments]
databricks SQL UDF in select statement
"List columns" statements when querying Databricks via ODBC
I've got an old .NET app running on Windows Server. The app submits queries to a serverless SQL Warehouse. I've noticed that each query ( SELECT statement) submitted by the app results in three statements in the SQL Warehouse. One statement containing the query submitted by the app, and two statements that look like Listing columns 'catalog : foo, schemaPattern : foo, tablePattern : resultssettable, columnName : null' . The query might take 200ms to execute. The "Listing columns" statements take about 90ms each to execute. In aggregate, these "Listing columns" statements double the duration of queries sent to this warehouse. How do I get rid of these freak'n "Listing columns" statements? Here is what I've done/tried: Tables in the query are full qualified with catalog and schema. Query specifies the names of the columns to retrieve (i.e., not a SELECT * FROM ... ). I have Use Native Query enabled in the DSN. I have Fast SQLPrepare enabled in the DSN. Enabling Ignore Tables Metadata from All Schemas in the DSN makes no difference. I configured the Databricks ODBC driver to pool connections. I have the 64-bit Databricks ODBC driver installed, version 2.11.00.1005. I don't have access to the .NET apps source. I have been using the following PowerShell script to recreate the issue and test configuration changes: $dsn = "DSN=Test Connection" $sql = @" SELECT col1 , col2 , ... FROM dev.foo.bar WHERE whatever = 1; "@ $conn = New-Object System.Data.Odbc.OdbcConnection $dsn try { $conn.Open() $cmd = $null $cmd = $conn.CreateCommand() $cmd.CommandText = $Sql $cmd.CommandTimeout = 30 $adapter = New-Object System.Data.Odbc.OdbcDataAdapter $cmd $adapter.MissingSchemaAction = [System.Data.MissingSchemaAction]::AddWithKey $table = New-Object System.Data.DataTable "foobar" [void] $adapter.Fill($table) return $table.Rows.Count } finally { if ($reader) { $reader.Close() } if ($cmd) { $cmd.Dispose() } } I feel like I missing […truncated]
Databricks SQL Alert - Scheduling Questions
Databricks SQL Alert — Question Set Help needed, I created a SQL alert in databricks to notify me when a new entry is added to a dataset/table within the last 24 hours. SQL SELECT COUNT(*) AS new_ FROM catalog.schema.table WHERE xyz IN ('a', 'b', 'c', 'd') AND datetime >= CURRENT_TIMESTAMP() - INTERVAL 24 HOURS; Within the Alerts panel, I set the condition as follows: First row Column name: new_ Operator: > Static value: 0 I then added my email address in the Notifications section and set "When alerting, notify" to Always . I then selected View Alert , where I created a schedule — let's say every day at 9:00 AM . Questions a) How exactly does the schedule work here? I am asking because I selected "Always" under the notification settings, but I have also created a schedule to run every day at 9:00 AM. What is the relationship between these two settings? b) Let's suppose I build this alert and create the schedule as described above. Person B (sales dept rep) also subscribes to this alert. I do not want Person B to receive an alert unless the new record belongs to the Sales department. For example, if a new record is added that belongs to a department other than Sales, and the scheduled alert runs at 9:00 AM, will Person B still receive an email notification? Thanks in advance for any clarification! submitted by /u/SquareLong2523 [link] [comments]
Busting SQL Migration Myths: How New SQL Features Make Lift-and-Shift to Lakehouse Easier
New Databricks SQL Scripting features enable direct lift-and-shift migrations of legacy PL/SQL, allowing teams to translate procedures, cursors, temp tables, and transactions line for line without rewriting business logic. Once migrated, these procedures retain their original control flow while gaining built-in Unity Catalog lineage and access control.
Databricks Dashboard - Scheduling Questions
( FYI, I did write the initial draft of this message by myself, and then later asked AI to proof read it and later pasted the same here, Apologies in advance!) I recently developed and published a Databricks dashboard for a personal project, and I want to learn how the scheduling feature works. For context, I have read the Databricks documentation, Manage scheduled dashboard updates and subscriptions | Databricks on AWS , but I couldn't find answers to the questions below. Databricks Dashboard — Question Set 1 I published the Databricks dashboard using Individual Data Permissions . I then added another person as a participant, created a schedule, and subscribed to the schedule from both accounts. Let's call them Person A (publisher + subscriber) and Person B (subscriber). Questions a) Assume Person B works in the Sales department and should only be able to see Sales data. Since the schedule was created by Person A, when the scheduled run occurs and Person B receives the email notification they subscribed to, will the PDF attachment contain all departments' data , or will it contain only the data Person B is permitted to see? b) After the scheduled run, if Person B opens the dashboard using the link in the email notification, or accesses the dashboard directly through Databricks, what data will they see? Will they see all department data , or only the data they are permitted to see based on their individual data permissions? My understanding is that when Person B visits the dashboard, it does not automatically refresh just because a scheduled dashboard update has occurred. I may be misunderstanding how this works, so I'd appreciate some clarification. Databricks SQL Alert — Question Set 2 I also created a SQL alert to notify me when a new entry is added to a dataset within the last 24 hours. Please note: The screenshot below is not from my actual example. I am only including it so that new developers like myself can relate to what I am referring to. enter image descr […truncated]
Tagging individual ai_query() calls in SQL?
Essentially the title, but for background we’re using ai_query() in Databricks SQL Warehouse and our pipeline makes 3 LLM calls in parallel for different steps. We can see token usage/cost in system.ai_gateway.usage, but we can’t tell which call came from which step. From what I can tell, request tags are possible via the Python/rest sdk, but not through ai_query() in SQL. Has anyone found a workaround, or is moving the calls out of SQL currently the only option? Edit for clarity: the main thing we’re trying to do is join each pipeline step back to system.ai_gateway.usage so we can attribute token usage/cost to steps a/b/c etc submitted by /u/hulioshort [link] [comments]
 News
NewsHow AI and Data Keep 2.3 Million Lawns Healthy | TruGreen & Databricks
TruGreen uses Databricks Genie and Lakehouse to manage 2.3 million lawns with AI that optimizes service timing and predicts customer churn using weather, soil, and service data. The system enables non-technical branch managers to take daily actions through customized reports without requiring data expertise.
Load Testing Databricks SQL Warehouses with JMeter — Part 3: Running and Analyzing Results
Load Testing Databricks SQL Warehouses with JMeter — Part 2: Concurrency and the Test Plan
Load Testing Databricks SQL Warehouses with JMeter — Part 1: Inputs and Configuration
Serve Tableau Reports Directly from Databricks SQL
Understanding EXPLAIN FORMATTED in Databricks SQL
Building a soccer coaching app on Databricks
Coach's Corner is a Databricks App that processes 25 fps match tracking data into a sub-second 2D/3D tactical bench with replays, event analytics, a scout chat, and an opponent-dossier agent. The end-to-end solution is powered entirely on the Databricks platform, utilizing Lakeflow pipelines for data refinement, DBSQL and Lakebase for rapid querying, and Unity Catalog-governed AI tools like Genie, Vector Search, and MLflow tracing.
 News
NewsLearn about Zerobus in 15 min!
Databricks Lakeflow Connect Zerobus Ingest is a high-performance, multi-cloud ingestion service that allows users to stream event data directly into their lakehouse without the cost and complexity of a traditional message bus. The video explains the architecture of Zerobus Ingest, announces upcoming API integrations for Kafka and MQTT, and demonstrates how to configure and run a Python client to write data directly into a Delta table.
Introduces catalogs.yml v2 support, a skip_optimize config for opting out of post-materialization OPTIMIZE, and Rust kernel backend for SQL warehouses. Fixes numerous incremental model bugs around constraints and tags, but now requires --full-refresh to apply changes to primary/foreign key expressions.
 Releases
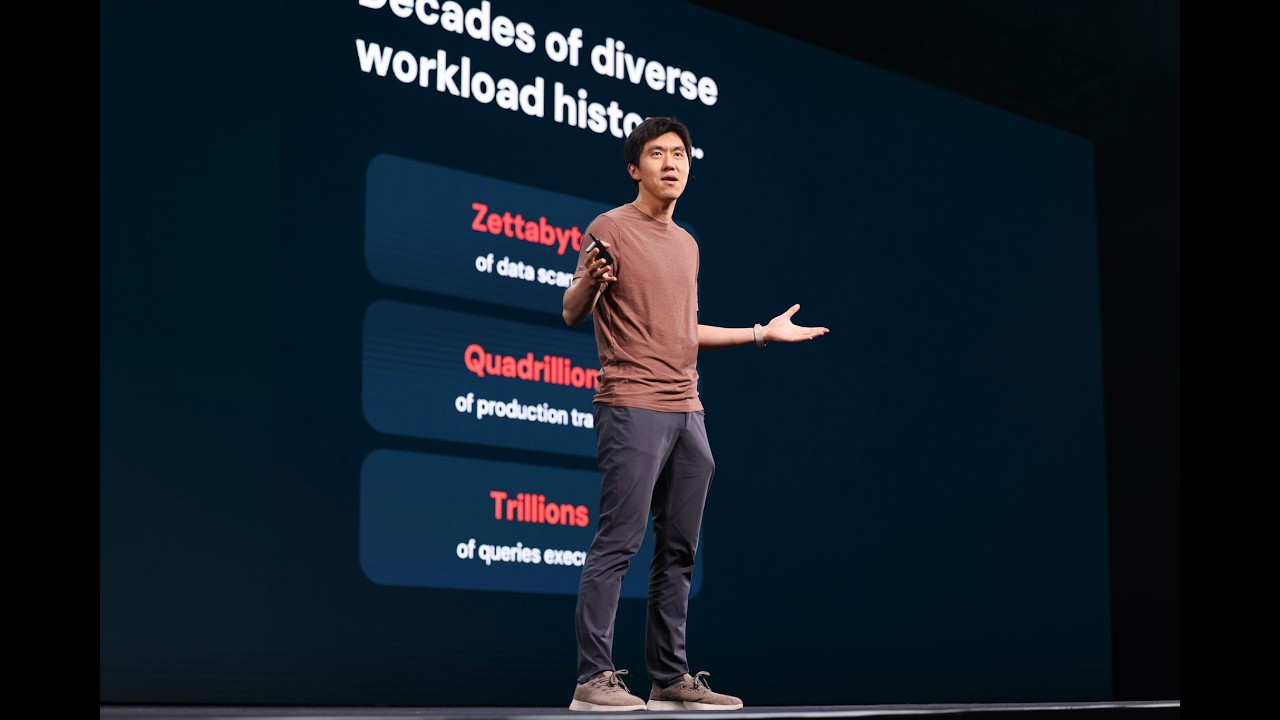
Lakehouse//RT, the real-time Lakehouse powered by Reyden — Reynold Xin, Co–founder & Chief Architect
Databricks introduces Lakehouse//RT, a new SQL warehouse powered by the Raiden engine, designed to provide millisecond performance and massive concurrency for real-time analytics directly on data lake formats like Delta and Iceberg. This innovation aims to unify data warehousing and serving stacks, eliminating the need for separate systems and data copies.
DBSQL MCP output limit
Querying Metric Views via Classic/Pro SQL Warehouses
Incremental REPLACE WHERE Flows Brings Targeted Refreshes to SDP and DBSQL
Sciene AI Companion: building an autonomous Customer Success platform on Databricks
Sciene built an autonomous Customer Success platform on Databricks, enabling AI-powered CSMs to standardize and scale work with context-aware emails, meeting decks, and account diagnostics. This end-to-end Databricks solution, leveraging Delta Sharing, Lakebase, and SQL Warehouses, significantly improved productivity and saved up to 6x time on key workflows.
Restrict certain queries on SQL Warehouse
1.12.1
dbt-databricks 1.12.1 exposes job run IDs in adapter responses for correlating dbt runs with Databricks workflow executions and adds support for SPOG account-level vanity URLs. The release fixes critical issues including Iceberg incremental models losing clustering, column constraint enforcement now gated to require explicit contract.enforced: true, and various SQL warehouse compatibility problems.
Databricks Asset Bundles now includes a select flag in the direct deployment engine to plan and deploy specific resource subsets, along with support for Terraform references and automatic transient HTTP retries. The experimental open command expands to support additional workspace resources such as volumes and vector search endpoints, while notebook task paths now correctly preserve Lakeflow Designer files.
SQL Warehouse stuck on "Cluster Start-up Delayed"
Query Tags: The Context Your Warehouse Queries Have Been Missing
Databricks SQL warehouses now support query tags, enabling cost attribution by team or project and automatic tagging for dbt, PowerBI, and Tableau. Tag queries from any source, including the SQL Editor, Notebooks, Dashboards, APIs, connectors, and drivers.
Databricks SQL connection becomes stale in long-running app
Databricks SQL Just Dropped Some Massive Engine Upgrades for Data Engineers
Announcing Lakebase Change Data Feed (CDF)
Lakebase Change Data Feed (CDF) is now in Public Preview, eliminating pipeline sprawl from operational databases by exposing every table's changes through Unity Catalog Managed Tables. This enables native CDC governed end-to-end without sidecar infrastructure, allowing operational data to function as the native Bronze layer in the medallion architecture.
Debugging a Databricks Federated Query
Hi, I came across an interesting question on the Databricks Community, and I thought I would share my findings in case someone else runs into the same issue. Maybe this will help save some time debugging. The setup was as follows: * SQL Server was registered as a federated connection in Unity Catalog. * Queries were executed directly from Databricks against federated SQL Server tables. * The user who created the thread executed a query using standard date functions such as `YEAR()` and `MONTH()` against a federated table. Example of query that was executed: SELECT MONTH(order_date) AS order_month, YEAR(order_date) AS order_year, COUNT(*) AS total_orders FROM federated_db.sales.orders GROUP BY MONTH(order_date), YEAR(order_date) However, the query failed with the following error: `com.microsoft.sqlserver.jdbc.SQLServerException: 'EXTRACT' is not a recognized built-in function name. at` So, what is happening here? At first glance, this looks confusing because SQL Server does support the `YEAR()` and `MONTH()` functions. As it turns out, in Databricks SQL, `YEAR()` and `MONTH()` are synonyms for the ANSI **EXTRACT()** function. https://preview.redd.it/5grz6yvu7n3h1.png?width=765&format=png&auto=webp&s=19cb791a079ddbbe2eb696f77d1693028d0bd722 That is where the problem occurs: SQL Server does not support the ANSI `EXTRACT()` syntax, so the federated query fails. To work around this, you can try rewriting the query in a way that is compatible with the federated execution path. Alternatively, you can use the **remote\_query()** function, which allows you to run SQL directly against the external database using the native SQL syntax of the remote system. Orignal thread: [Re: Extract SQL function in SQL Server federated d... - Databricks Community - 157392](https://community.databricks.com/t5/data-engineering/extract-sql-function-in-sql-server-federated-database/m-p/157397#M54544)
Why Databricks Genie returns MessageStatus.FAILED in App API (but works fine in UI) — solved
Hey fellow Databricks builders, Our team at **Enqurious** just wrapped a hackathon building a full medallion architecture (Bronze → Silver → Gold) with Genie AI integration for natural language querying. We hit a wall that cost us 6+ hours — sharing the full fix so you don't have to. # What was the setup? * Gold layer tables in Unity Catalog * Genie Space configured and working in UI * Databricks App deployed successfully # What causes MessageStatus.FAILED in Databricks Genie App API? The root cause is a missing service principal permission chain. The Databricks App runs under a **service principal** — not your user account. Genie working in the UI only proves *your user* has access, not the service principal the App uses at runtime. This is why the same question works in the Genie UI and fails via the App API every time. # What is the complete permission fix? The service principal needs **all five** of these — missing any one causes silent failures: sql -- 1. Catalog level (most commonly missed) GRANT USE CATALOG ON CATALOG your_catalog TO `your-app-service-principal`; -- 2. Schema level GRANT USE SCHEMA ON SCHEMA your_catalog.your_schema TO `your-app-service-principal`; -- 3. Table level — each table individually GRANT SELECT ON TABLE your_catalog.your_schema.table_1 TO `your-app-service-principal`; GRANT SELECT ON TABLE your_catalog.your_schema.table_2 TO `your-app-service-principal`; **Plus in the UI:** * SQL Warehouses → your warehouse → Permissions → Add service principal → **Can Use** * Genie Space → Share → Add service principal → **Can Run** # Where do you see the real error (not just MessageStatus.FAILED)? The actual error is in the **Genie Monitoring tab** inside your Genie Space — not the App logs. App logs only show the generic `MessageStatus.FAILED`. The Monitoring tab shows the specific SQL error or permission denial that caused it. This single tip would have saved us 3 of those 6 hours. # How long do Databricks permissions take to propagate? Unity Catalog permissions take **5–15 minutes** to propagate. Testing immediately after granting permissions is the most common reason the fix appears not to work. Wait 10 minutes, hard-refresh your browser, then retest. # Quick debug checklist If you're still hitting `MessageStatus.FAILED`: □ Check Genie Monitoring tab for the actual SQL error □ Confirm service principal has USE CATALOG (not just SELECT) □ Confirm SELECT on each table individually — schema-level alone is not enough □ Confirm SQL Warehouse is Running, not Stopped □ Wait 10 minutes after any permission change before retesting □ Hard refresh browser before retesting □ Verify app.yaml uses ["streamlit", "run", "app.py"] — not ["python", "app.py"] # FAQ **Q: Why does Genie work in the UI but fail in the Databricks App?** A: The App runs under a service principal, not your user account. The service principal needs its own separate permission chain regardless of your personal access. **Q: Is USE CATALOG required even if SELECT is granted on all tables?** A: Yes — USE CATALOG is mandatory. Without it the service principal cannot traverse the catalog hierarchy, even with table-level SELECT grants. **Q: Where is the real error when Genie fails in an App?** A: Genie Space → Monitoring tab. App logs only show the generic failure; Monitoring shows the specific cause. **Q: How long do Unity Catalog permissions take to propagate?** A: 5–15 minutes. Always wait before retesting. The Enqurious team wrote up a full walkthrough with SQL commands, screenshots, and the complete [app.py](http://app.py) template Happy to share our Genie Space config or [app.py](http://app.py) in the comments — just ask. **Questions for the community:** * Has anyone else faced similar Genie + App permission issues? * Is there a better way to debug these permission chains? * Would love to hear if Databricks is working on si […truncated]
Azure Databricks Excel Add-in fails in TableSelector even with correct Unity Catalog permissions
https://preview.redd.it/fe1yz91o4f2h1.png?width=800&format=png&auto=webp&s=fb4d699ae3cf49538b46033cc63e2b8aaf44fd95 Hi everyone, I’m having an issue with the Azure Databricks Excel Add-in when trying to query a Unity Catalog table/view from Excel. The user already has the following permissions: * `USE CATALOG` on the catalog * `USE SCHEMA` on the schema * `SELECT` on the table/view * `BROWSE` on the catalog * `CAN USE` permission on the SQL Warehouse However, when using the visual table selector / preview option in the Excel Add-in, Excel shows the following error: Excel Operation Failed Excel operation failed in TableSelector { "ok": false, "status": 200, "statusText": "", "body": { "statement": "SELECT `SOC_ID` FROM `qa_gold`.`bix_cmr_ab_nacional`.`vtx_cmr_gestion_comercial` LIMIT 1000", "warehouseId": "73771902e1b3c9e5" } } The SQL statement shown in the error is: SELECT `SOC_ID` FROM `qa_gold`.`bix_cmr_ab_nacional`.`vtx_cmr_gestion_comercial` LIMIT 1000; I already confirmed that the SQL Warehouse permission is assigned, and the Unity Catalog privileges seem to be correct. Has anyone seen this issue before with the Azure Databricks Excel Add-in? I’m trying to understand whether this is: 1. A permissions issue still missing somewhere, 2. A problem with the Excel Add-in TableSelector / Preview feature, 3. A limitation or bug in the current Excel Add-in, 4. Or something related to the specific view/materialized view being queried. Any suggestions on what else to validate would be appreciated. Thanks!
TruProxy - Live Databricks Cost Estimator - SQL Warehouses
Hi everyone, I'm making progress building TruProxy, a **live cost estimator** for Databricks to get immediate cost estimates **every second** instead of having to wait for the system tables to update. see [Live Cost Estimator : r/databricks](https://www.reddit.com/r/databricks/comments/1t67zhe/live_cost_estimator/) & [TruProxy - Live Databricks Cost Estimator - Clusters : r/databricks](https://www.reddit.com/r/databricks/comments/1tbs0tf/truproxy_live_databricks_cost_estimator_clusters/) I've finished the view for SQL Warehouses and have shared the progress on [YouTube](https://www.youtube.com/watch?v=rkWoj-Z0MyI). We'll continue to share the progress there. I'm looking for **feedback & beta users** and now have a first version to share: [truproxy — live cost visibility for Databricks](https://databricks.trupositive.ai/). Let me know what you think!
Automate Data & KPI Monitoring with SQL Alerts
Databricks SQL Alerts is now Generally Available, enabling automated data quality and KPI monitoring that notifies owners whenever query results breach defined thresholds. Practitioners can author alerts using standard SQL or Genie Code, or run them inline as Lakeflow Jobs tasks to dynamically route downstream pipeline execution.
Announcing the Databricks analytics engineer learning pathway
A new learning pathway for Databricks SQL practitioners is now available on Databricks Academy, covering skills to use the full SQL ETL toolkit for data modeling, pipelines, semantic layers, and conversational agents. Courses are offered in self-paced and instructor-led formats, and are included with any active Databricks Learning Subscription.
Beta alert: Materialized Views and Streaming Tables in Serverless Notebooks
Hi folks, Wanted to share a new feature that's in [beta](https://docs.databricks.com/aws/en/ldp/dbsql/compute#serverless-general-compute) \- creating and refreshing materialized views and streaming tables from serverless compute! Users can create MVs natively in SQL or using `spark.sql("CREATE MATERIALIZED VIEW test_mv AS SELECT * from samples.wanderbricks.booking_updates")` in their notebooks and jobs attached to serverless compute. Workspace admins can enable the beta feature, "MV and ST in Serverless Notebooks and Jobs" in their preview settings. It’s currently available in [select regions](https://docs.databricks.com/aws/en/resources/feature-region-support#serverless-aws). Would love to hear y'all's feedback!
Introducing 5XL SQL Warehouses: A Practical Guide to Meeting SLAs for Your Most Demanding Workloads
Modular structure for Databricks Apps (Streamlit)
Hey, I wanted to share something that's been bugging me for a while and get your take. The official Databricks Streamlit tutorial puts everything into a single **app.py.** Fine for a demo. But the moment a real internal app grows past \~500–600 lines, it stops being fun: * Two people on the team touch the same file → merge conflicts every PR. * Hard to write unit tests when UI, data access, and business logic live in one module. * Git diffs become unreadable, and code review suffers. * When I point Cursor/Claude at the repo, it has to re-read the whole monolith on every prompt. Context window and cost both balloon. So I refactored our internal template into something more boring and modular: app. py # entry point only, routing pages/ ├── home. py ├── analytics. py └── settings. py components/ # reusable UI bits services/ # SQL warehouse / UC / SDK calls assets/ ├── styles.css └── logo.png tests/ *This is my own repo, not a product. Sharing because the single-file pattern bit us hard, and I figured others might find it useful -* [*https://github.com/protmaks/databricks\_apps\_streamlit\_mod\_template*](https://github.com/protmaks/databricks_apps_streamlit_mod_template)
Serverless SQL Warehouses Strategy
Hi, we're a big industrial company and have some pretty diverse use cases in terms of data volume, speed requirements etc. Many of them are quite sporadic (serving data to PowerBI dashboards which are queried a few times per day, but need to be performant then). We are currently thinking on how to provision SQL Serverless Warehouses to our users. How do you do this in your companies: \- Do you have one (or a few) larger warehouses that serve all different use cases? Or \- Do you create / have users create their own warehouses per use case? \- Or do you use a/multiple shared classic warehouses running 24/7? Cost allocation wise the latter one is easier to track, but from a compute cost point of view I imagine the former one is probably more efficient?
Why You Cannot Choose the SQL Warehouse in Databricks Chat & Assistant Features?
How Switching from JDBC/ODBC Clusters to Serverless SQL Warehouses Boosted Our Power BI Performance
pivot() workarounds in Lakeflow Spark Declarative Pipelines
Problem: In Lakeflow Spark Declarative Pipelines, the `pivot()` function is not supported. The `pivot` operation in Spark requires the eager loading of input data to compute the output schema. This capability is not supported in pipelines. Source: [https://docs.databricks.com/aws/en/ldp/limitations](https://docs.databricks.com/aws/en/ldp/limitations) # How can this be mitigated? **Workaround 1: Rewrite PIVOT Using CASE WHEN** This is the most common workaround. You manually expand the pivot into conditional aggregations. >Original Query: SELECT * FROM sales_data PIVOT ( SUM(sales) FOR region IN ('North', 'South', 'East', 'West') ) >Rewritten without PIVOT: SELECT product, SUM(CASE WHEN region = 'North' THEN sales ELSE 0 END) AS North, SUM(CASE WHEN region = 'South' THEN sales ELSE 0 END) AS South, SUM(CASE WHEN region = 'East' THEN sales ELSE 0 END) AS East, SUM(CASE WHEN region = 'West' THEN sales ELSE 0 END) AS West FROM sales_data GROUP BY product This works perfectly in Lakeflow Pipelines because the output schema is fully deterministic at parse time, no eager data loading required. **Workaround 2: Rewrite PIVOT Using aggregate FILTER** Databricks SQL supports the `FILTER(WHERE ...)` clause on aggregates, which is a cleaner alternative to CASE WHEN: >Original PIVOT query: SELECT year, region, q1, q2, q3, q4 FROM sales PIVOT ( SUM(sales) AS sales FOR quarter IN (1 AS q1, 2 AS q2, 3 AS q3, 4 AS q4) ) >Rewritten with FILTER: SELECT year, region, SUM(sales) FILTER(WHERE quarter = 1) AS q1, SUM(sales) FILTER(WHERE quarter = 2) AS q2, SUM(sales) FILTER(WHERE quarter = 3) AS q3, SUM(sales) FILTER(WHERE quarter = 4) AS q4 FROM sales GROUP BY year, region This syntax is often more readable than nested CASE WHEN, especially with multiple aggregations. **Multi-Column PIVOT Rewrite** >For pivoting on multiple columns simultaneously: SELECT * FROM sales PIVOT ( SUM(sales) AS sales FOR (quarter, region) IN ((1, 'east') AS q1_east, (1, 'west') AS q1_west, (2, 'east') AS q2_east, (2, 'west') AS q2_west) ) >Rewritten: SELECT year, SUM(sales) FILTER(WHERE quarter = 1 AND region = 'east') AS q1_east, SUM(sales) FILTER(WHERE quarter = 1 AND region = 'west') AS q1_west, SUM(sales) FILTER(WHERE quarter = 2 AND region = 'east') AS q2_east, SUM(sales) FILTER(WHERE quarter = 2 AND region = 'west') AS q2_west FROM sales GROUP BY year **Multiple Aggregations** You can also rewrite PIVOTs that use multiple aggregate functions. >Original Query SELECT * FROM (SELECT year, quarter, sales FROM sales) AS s PIVOT ( SUM(sales) AS total, AVG(sales) AS avg FOR quarter IN (1 AS q1, 2 AS q2, 3 AS q3, 4 AS q4) ) >Rewritten: SELECT year, SUM(sales) FILTER(WHERE quarter = 1) AS q1_total, AVG(sales) FILTER(WHERE quarter = 1) AS q1_avg, SUM(sales) FILTER(WHERE quarter = 2) AS q2_total, AVG(sales) FILTER(WHERE quarter = 2) AS q2_avg, SUM(sales) FILTER(WHERE quarter = 3) AS q3_total, AVG(sales) FILTER(WHERE quarter = 3) AS q3_avg, SUM(sales) FILTER(WHERE quarter = 4) AS q4_total, AVG(sales) FILTER(WHERE quarter = 4) AS q4_avg FROM sales GROUP BY year **Summary** Both approaches produce identical results and work fully within SDP pipelines with complete lineage tracking.
Live Cost Estimator
I'm building a **live cost estimator** that doesn't have to wait for the system tables or billing data to update. It gives me immediate cost feedback every second and I'm sharing the development journey on YouTube. I already have live costs estimates for **all-purpose clusters, SQL warehouses and interactive serverless compute.** I would love some feedback, suggestions and if you want to try it out or contribute let me know!
Get Tuesday's version of this
Tracking Databricks SQL? The Tuesday email carries what moved across the whole ecosystem, not just this topic. Free, one-click unsubscribe.