
Tableau
Recent items mentioning Tableau across the Databricks ecosystem — releases, news, videos, and community Q&A. Updated hourly.
A practitioner is asking how to migrate ~150 Tableau dashboards to Databricks AI/BI at scale, exposing that large-estate migration tooling is still an open problem 1. The Databricks community's counter-approach: skip the rebuild entirely and serve Tableau reports directly from Databricks SQL 4.
Written August 2026 from the 4 most recent items mentioning Tableau at that time. It refreshes when this topic next has enough new material. Click any [N] to jump to the source.
Unable to connect to Tableau Cloud
Is Databricks Replacing Power BI and Tableau in the Enterprise?
Why did Databricks get into the BI tooling space & what does it mean for Databricks customers using Power BI, Tableau, and other established BI tools? In this 3-min video, David Meyer (SVP @ Databicks) shares how Databricks can help both provide advance decision making capabilities and lower costs, as well as where some of the older tools fit in your stack. This was recorded in front of a live audience at the Databricks Data + AI Summit 2026. Hope you enjoy it, and would personally love to hear your stories, both where AI/BI Dashboards from Databricks has been able to take on more of your BI workloads, as well where you still find gaps that need to be addressed! submitted by /u/JosueBogran [link] [comments]
Has anyone tried the new Databricks AI/BI feature?
I recently came across Databricks AI/BI and was curious to know how people are finding it. It looks like Databricks is trying to bring BI and analytics more directly into the Databricks platform, with dashboards and Genie for asking questions in natural language. Has anyone actually tried AI/BI in a real project? How is it compared to Power BI or Tableau from your experience? Is it good enough for regular BI use cases, or is it still better to use a separate BI tool? Would like to know your experience, especially if you have used both. submitted by /u/Bhanuprakash_1947 [link] [comments]
Moving ~150 Tableau dashboards to Databricks AI/BI - anyone done this at scale?
We are considering moving from Tableau to Databricks AI/BI Dashboards and wanted to see if anyone here has made a similar move. We currently have around 150 Tableau dashboards used by 1,000+ users, with a mix of technical and non-technical users. Most of the underlying data already lives in Delta tables, so naturally we're looking at whether it makes sense to consolidate and use Databricks for the dashboarding layer as well. For those who have done this, how has the experience been? Anything you wish you knew before migrating? Any major limitations compared to Tableau, especially around visualization, performance, or the experience for non-technical users? I'm also curious about cost at scale. With 1,000+ users potentially hitting dashboards, did SQL warehouse usage become a concern? Would you feel comfortable replacing Tableau completely with AI/BI Dashboards today, or do you still find yourself needing Tableau for certain use cases? Would really appreciate hearing about real-world experiences. submitted by /u/Immediate_Bus5250 [link] [comments]
Attach files in Genie Code
Genie Code is getting a new feature 🥳 Good news you can attach a document to Genie Code when you need it as temporary context for the current conversation. What's a good use case? 🔴 Explain or summarize a document: “Summarize this PDF and list the key decisions.” 🔴 Extract information from PDFs, scans, or images. 🔴 Generate code based on a specification: attach a requirements document and ask Genie Code to create Python or SQL. 🔴 Analyze data files such as CSV, Excel, JSON, or JSONL. 🔴 Convert documentation into code, tests, or a notebook. 🔴 Interpret diagrams, charts, architecture sketches, or screenshots. 🔴 Migrate Tableau or Power BI files into AI/BI dashboards using /importBI. What are the supported file types ? .pdf, .csv, .xlsx, .xls, .json, .jsonl, and common image formats. submitted by /u/Youssef_Mrini [link] [comments]
 Tutorials
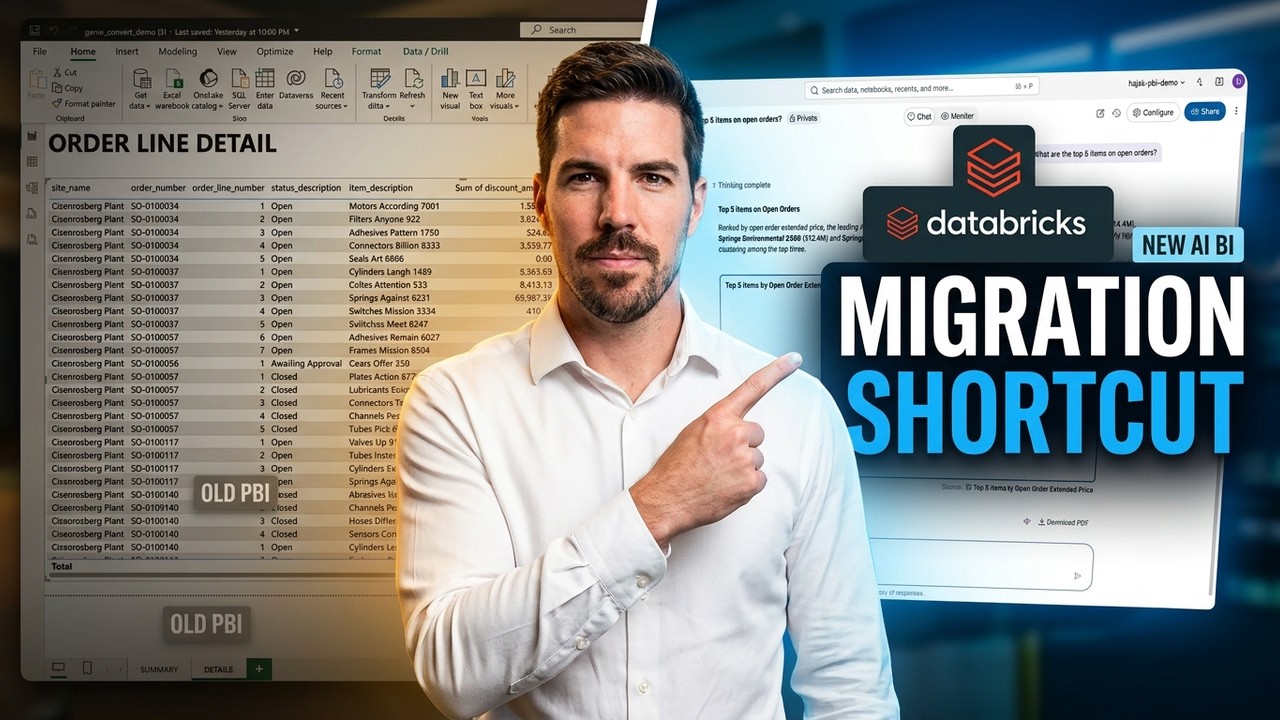
Power BI to AI BI: The Migration Shortcut You Need
The video demonstrates how to use Databricks Genie Code to automate the migration of Power BI report files into Databricks AI BI dashboards and semantic models. It walks through preparing a Power BI file, launching the import tool, generating the dashboard, and enabling an integrated Genie space for natural language data querying.
Serve Tableau Reports Directly from Databricks SQL
Serving Tableau and Databricks Dashboards from One Gold Layer
From Tableau to Databricks: Migrating KPI Dashboards with Metric Views
Query Tags: The Context Your Warehouse Queries Have Been Missing
Databricks SQL warehouses now support query tags, enabling cost attribution by team or project and automatic tagging for dbt, PowerBI, and Tableau. Tag queries from any source, including the SQL Editor, Notebooks, Dashboards, APIs, connectors, and drivers.
Power BI/Tableau to Databricks the new way!
Have you noticed the new feature that allows for direct migration from Power BI/Tableau to Power BI using Genie Code? Currently it is a Beta feature. I took it for a spin and I am quite impressed to be honest. It took my semantic model and converted it to Metric Views 1:1. Except for a few DAX specific functions (which were flagged to me) everything was working the same way as in Power BI, including relations, measures etc. One thing I noticed is that Genie Code thought it should be able to convert the visual side as well, however it kept saying that there were no visuals in my exported .pbit file. \- I worked around it by including a screenshot, which it then rendered into the visuals correctly. [https://www.linkedin.com/feed/update/urn:li:activity:7464937157162541057/](https://www.linkedin.com/feed/update/urn:li:activity:7464937157162541057/) Anyone from Databricks that can give a heads up on that part - why does it not recognize the visuals from the file?
Reports migration made easy through genie Code!
Genie Code now supports migrating from Tableau and PowerBI. With the new /𝒊𝒎𝒑𝒐𝒓𝒕𝑩𝑰 command, you can: → Upload a .twb, .twbx, .tds, .tdsx, or .pbit file directly → Auto-generate an AI/BI dashboard that mirrors your existing visualizations → Convert measures & dimensions into reusable metric views → Promote them to Unity Catalog for governance, lineage, and access control The migration path that used to take weeks now starts with a single command.
Databricks now supports importing Tableau and Power BI files into Genie Code to automatically build
Databricks now supports importing Tableau and Power BI files into Genie Code to automatically build AI/BI Dashboards with Metric Views
With **Genie Code**, you can now add a Tableau or Power BI file and have it build an **AI/BI dashboard** that replicates your existing visualizations - while connecting them to **metric views** that mirror the underlying business logic. [Import BI files using Genie Code - Azure Databricks | Microsoft Learn](https://learn.microsoft.com/en-us/azure/databricks/dashboards/manage/import-bi#requirements) Many organizations have years of BI logic embedded inside workbooks, reports, templates, and semantic layers. Rebuilding that logic manually in a new platform can be slow, error-prone, and difficult to govern. This new workflow helps accelerate that migration path: 1. Upload a Tableau or Power BI file directly into Genie Code Supported formats include `.twb`, `.twbx`, `.tds`, `.tdsx`, and `.pbit`. 2. Use the `/importBI` command in Agent mode Genie Code imports the BI asset and generates an AI/BI dashboard. 3. Review the generated dashboard and metric views Measures and dimensions from the original file are transformed into metric views. 4. Promote metric views to Unity Catalog This makes them reusable across dashboards, Genie Spaces, and notebooks, while adding governance, lineage, access controls, and discoverability. Currently, there is also a 100 MB limit for direct file uploads. For larger files, the recommended path is to store the file in a Unity Catalog volume and reference it directly, for example: `/importBI @/Volumes/my_catalog/my_schema/my_volume/sales_workbook.twb`
Is Databricks AI/BI Genie worth it if we already have Power BI or Tableau?
Why do people use databricks vs say power bi or tableau
Hi im curious to know why organisations have like tableau and power bi and then data bricks. Like what's the point in all 3. If all your materliased views are in data bricks and you can connect and make reports etc then shouldn't that be the single source of truth? Like what makes someone use tableau or power BI aside from the fact that data isn't in databricks or you want to do advanced visualisations? Would appreciate some thoughts please.
Tableau Prep to Databricks Error
Databricks on Azure or Aws
We are getting databricks and we dont care where we host as we are new into this. Azure is giving us great pricing and incentives. AWS is not at all bothered. they are like take it or leave it. Any one who has used it in either environments, think if there is a good reasson to choose one vs the other? our reporting is tableau.
Tableau and dbt MCPs together
Tableau and dbt MCPs can now be configured together in a single file. Learn how this pairing unlocks impact analysis, metric reconciliation, and more.
 Events
Data Sharing and Cross-Organization Collaboration. Presented by Matei Zaharia at Data + AI Summit
Cross-organization data sharing and collaboration is increasingly critical for streamlining business processes across industries. Databricks addresses this need through Delta sharing, an open protocol that allows secure data exchange across different platforms and clouds without requiring recipients to use the same data warehouse.
 Events
The Best Data Warehouse is a Lakehouse
Databricks SQL provides data warehousing capabilities on a lakehouse architecture, integrating core database features, governance, and business intelligence integrations. The platform utilizes AI systems to deliver automated query optimization, performance scaling, and built-in vector search functions.
 News
NewsUsing Databricks to Power Insights and Visualizations on the S&P Global Marketplace
S and P Global uses Databricks to manage data, write code, and run heavy computations before feeding results into visualization tools for the S and P Global Marketplace. Databricks enables cross-functional teams to collaborate in a single workspace to build coverage templates and custom showcase visualizations that help clients explore data.

 News
NewsUnlock the Next Evolution of the Modern Data Stack With the Lakehouse Revolution -- with Live Demos




Get Tuesday's version of this
Tracking Tableau? The Tuesday email carries what moved across the whole ecosystem, not just this topic. Free, one-click unsubscribe.