


Power BI
Recent items mentioning Power BI across the Databricks ecosystem — releases, news, videos, and community Q&A. Updated hourly.
Unity Catalog metric views can now be published directly to Power BI semantic models, establishing a unified semantic layer across Power BI, AI/BI dashboards, and Genie using DirectQuery to enforce Databricks governance 34. As teams operationalize this integration, practitioners are working through calculation discrepancies on metric view totals via live connection workarounds 5 while utilizing metric views as the foundational stepping stone to migrate legacy Power BI reports to Databricks Genie 8.
Generated daily from the 10 most recent items mentioning Power BI. Click any [N] to jump to the source.
Dataverse (D365): Synapse Link or Fabric Link?
Hi, in your view, what’s the best option for retrieving data from Dataverse (D365 F&O)? “Azure Synapse Link” (without Synapse Workspaces) or “Fabric Link”? Microsoft seems to be focusing primarily on Fabric. That’s why I’m concerned about starting with Synapse Link only to find out next year that they’re discontinuing it. However, with Synapse Link you have a bit more control over the exported data, as it’s stored in ADSL Gen 2 storage rather than in Dataverse, as is the case with Fabric Link. We also use Power BI in our company and, as far as I know, we have a small Fabric licence. submitted by /u/youderkB [link] [comments]
Seeking feedback on my Databricks data engineering portfolio project
Hi everyone, I’m preparing to apply for junior/entry-level Data Engineer roles focused on Databricks, and I’d appreciate honest feedback on a portfolio project I’ve been building. It is a governed lakehouse project for a synthetic table-tennis e-commerce dataset: - Deterministic input contract and synthetic fixture with intentional duplicates, malformed records and quality issues. - Bronze ingestion designed around Databricks Asset Bundles, Auto Loader, append-only raw tables, lineage metadata and retained checkpoints. - Silver transformation with explicit validation rules and a quarantine layer. - Gold publication with privacy controls: only aggregated, non-PII cells that meet a k-anonymity threshold are published. - Unity Catalog / Terraform / dedicated service principal / least-privilege model. - Manual serverless Databricks Job with materialization followed by a read-only verifier. - 287 local tests covering contracts, transformations, bundle configuration, verifier logic and Terraform privilege rules. The current DEMO-001 cloud milestone produced: - Silver: 15 orders, 10 customers, 7 products - Quarantine: 6 expected rejected rows - Gold: €640 revenue, 5 orders, 0 refunded lines - Pre-suppression controls: €812.20, 13 orders, 2 refunded lines - Status: COMPLETED_WITH_QUARANTINE I have deliberately kept the scope honest: this is a fixed deterministic snapshot, not CDC, streaming, SCD, generic incremental processing, SQL Warehouse, Power BI, or a production monitoring setup. Repository: tt-ecommerce I would especially value feedback on: Does this demonstrate relevant Databricks/Data Engineering capability? What is missing before using it in applications? Would you prioritise finishing governance/consumer access, adding SQL Warehouse/BI, or CI/CD and operational monitoring? Is the documentation clear, or does it feel over-engineered for a portfolio project? What would you expect to see in a strong junior Databricks project that is not here yet? Thanks — direct criticism is welcome. submitted by /u/Alone-Cow-1563 [link] [comments]
Databricks Metric Views are coming back to Power BI! [Private Preview]
First I'd like to give a bit of background because if you feel like you've heard about this feature before, you're right. Previous attempt to bring Metrics Views to PBI was "blocked" when MS removed the required opiton from the connector. In February 2026 - the Power BI Databricks connector introduced Metric View BI Compatibility Mode (Beta). It allowed Power BI to query Unity Catalog Metric Views, with Databricks rewriting the generated SQL to handle measures correctly. In April , Microsoft removed that option from the connector. Reports relying on it stopped working. Now, in November , Databricks has announced a different approach. In new approach Databricks pushes metric view to Power BI semantic model, so ach metric view becomes a table, dimensions become columns, and measures are translated into DAX. You can publish the model from Catalog Explorer or automate it using a Lakeflow Job. There are a few limitations: - Synchronization is one-way, so changes made in Power BI don't flow back to Unity Catalog. - Import mode also changes the security model - imported data is governed by Power BI permissions. For me it's a long awaited feature. I've never been a fan of defining the same business metrics separately in different BI tools. In my opinion metric definitions should live as close to the data as possible, in a shared layer that different reporting tools can use. Connect metric views to Power BI - Azure Databricks | Microsoft Learn https://preview.redd.it/zysb9za0o51i1.png?width=1355&format=png&auto=webp&s=ff3ce75b6bd2c25735f1c368a0721f09cbed8627 submitted by /u/szymon_dybczak [link] [comments]
Unity Catalog Metric Views, now in Power BI: one unified, governed semantic layer for all your reporting and AI
Unity Catalog metric views can now be published directly to Power BI semantic models, establishing a single governed semantic layer across Power BI, AI/BI dashboards, and Genie. Teams can define data models and relationships once in Databricks, maintaining Unity Catalog access controls through DirectQuery while task orchestration keeps Power BI models in sync.
Power BI on Metric Views: why the totals go wrong, and a live connection that fixes them
What's new in AIBI Dashboard - October 2026
I couldn't add the screenshots easily you can find them over here https://personal.nextgenlakehouse.com/whats-new-in-aibi-dashboard-october-2026-cf83904106ab This release brings extensive additions to AI/BI Dashboards , expanding layout controls, visualization formatting, BI migration capabilities via Genie Code, and interactive filtering options. AIBI, Genie and BI Migration Bulk import from Power BI and Tableau : Accelerate legacy BI modernization by batch converting up to 100 Power BI or Tableau workbooks to native AIBI Dashboards, Metric Views eliminating manual reconstruction across large datasets. Import Power BI .tmdl files : Authors can upload Power BI .tmdl files to create metric views with the /importBI Genie Code skill. Genie Code for dashboard authoring : Genie Code can use images stored in your workspace as image widgets, not only uploaded files. The dashboard canvas stays visible while Genie Code builds datasets step by step, so you can watch widgets appear instead of seeing a blank screen. Genie Code can create dashboard materializations when you ask it to Data Modeling and Datasets Materialize SQL datasets (Beta) : Drastically reduce dashboard load times and save compute resources by precomputing results for raw SQL datasets alongside local metric views bypassing repetitive and heavy query execution. Lakehouse Real-Time warehouse support (Beta) : Power Operational and streaming analytics with sub second responsiveness by connecting AIBI dashboard with Lakehouse RT Decimal precision : Ensure absolute fidelity across financial and scientific reporting as Generated visualizations respect defined decimal precision rules. Select multiple tables when adding a data source : You can now select multiple tables at the same time in the Add data source picker when building a dashboard data model. Dashboard relationships, which let you build complex multi-fact data models scoped to an AI/BI dashboard, are GA. Visualization and Dashboard Design Custom theme scope : Custom themes no longer color the View queries dialog, widget context menus, or data reference popovers, matching the behavior of built-in themes. Funnel chart fields : Fields carry over when you change a chart to or from a funnel chart. Sankey label improvements : Labels on Sankey diagrams overlap less. Field picker tooltips : Hovering over a field or measure name in the field picker shows its full name in a tooltip. Layered combo charts : Authors can build combo charts from separate chart layers. Data labels and custom total label for waterfall charts : Authors can add data labels to waterfall charts and customize the total bar's display name, color, and label. Pivot table drill-down : Viewers can drill down through the row and column hierarchy of a pivot table one level at a time. Theme fonts for rich text titles : Rich text widget titles and descriptions inherit the dashboard theme's font styles. Faceted counters : You can facet a counter visualization to show one counter tile per dimension value. Tabbed editor popover height : Tabbed editor popovers keep their opening height instead of growing. Inactivity and Filters Single-field filter default : Changing the field on a single-field filter clears the previous field's default value. The filter falls back to All , or to None when All isn't allowed. Widget-level filter refresh : The values in widget-level filter refresh when a dataset changes, without a browser refresh. Private bookmarks : Dashboard viewers can save filter combinations as private bookmarks to return to later. Private bookmarks are visible only to the user who creates them. Legend cross-filtering : Selecting an item in a visualization's legend applies cross filtering Global filter display in embedded dashboards : Embedded dashboards can show, collapse, or hide global filters by default. Exporting, Delivery and Scheduled Tasks Granular PDF and Smarter email delivery : Get precise control over report sharing by compiling only select dashboard pages […truncated]
Do any other teams build web apps for fully flexible analytics/reporting?
Databricks dashboards are extremely limiting in their flexibility/capabilities (and I don't see that changing as they pursue everything AI/Agentic) and tools like Power BI have shitty CI/CD processes and still have their visualization limitations. Has anyone moved reporting/analytics to React/App Kit applications on Databricks for greater flexibility and ease of CI/CD? submitted by /u/TheOnlinePolak [link] [comments]
Lessons from a Power BI to Databricks migration: metric views first, then Genie
How Compare the Market cut report delivery from 6 weeks to under 1 by retiring most of its dashboards
Compare the Market cut report delivery time from 6 weeks to under 1 by retiring most of its dashboards, starting with an audit that turned up 179 abandoned Power BI reports. The team rebuilt its analytics around reusable dbt models, so new reports draw on shared logic instead of being built from scratch.
Power bi import gateway strategy
How are you guys that still use power bi via import mode designing your gateway authentication? We are new to databricks and have a lot of schemas that require different levels of AD access. Import mode is the company standard so no direct query sso auth. We are unsure how to design a scalable gateway strategy . Do we use a service principal or allow publishers to use their own credentials on the gateway? submitted by /u/curiouscsplayer [link] [comments]
Data bricks project idea for Data Analyst
I'm a Data Analyst planning to build my first Databricks project for my portfolio. I have experience with SQL, Excel and Power BI, but I'm new to Databricks. Could you suggest some good project ideas that would help me demonstrate Databricks skills from a Data Analyst perspective? submitted by /u/Impressive-Buy-4259 [link] [comments]
DatabricksXPowerbi Latency issues
Hi everyone, We are lately experimenting with Databricks and Powerbi and we’ve noticed that while on DirectQuery mode we have significant delays on the data loading in our Powerbi reports. Is this something that other people also face? I have to mention that even for one page /2 tables reports without an immense amount of data or transformations we face the same issue submitted by /u/Wrong_Oven_2675 [link] [comments]
Databricks BI vs Power BI: what are the actual dealbreakers?
We’re considering Databricks as the main analytics platform across a large insurer: controlling, accounting, risk, etc. Looking at the whole ecosystem—dashboards, Genie, Metric Views and the Excel add-in. The gaps I still see are hierarchical filters, bookmarks and finer layout/styling control. Drill-through and cross-filtering have improved a lot. People often cite Office integration as a dealbreaker. Excel integration is there. Power BI’s live PowerPoint add-in is a difference, but how useful is sharing a presentation when recipients may see different data—or nothing—depending on permissions? What Office workflows am I missing? What concrete requirements still make Power BI essential, beyond familiarity or better-looking reports? Anyone tried this at enterprise scale and hit a hard wall? We are kind of fortunate to be late to the party in the sense that we do not have a big Power legacy landscape to migrate. submitted by /u/Dampfschlaghammer [link] [comments]
Power BI to AI BI: The Migration Shortcut You Need
Is Delta Sharing the end of external ETL? My notes on Open vs D2D.
Just spent some time digging into the Unity Catalog and Delta Sharing documentation. Here’s the TL;DR on the two patterns for anyone looking to implement this: Open Sharing (The "Universal" Path): Audience: Recipients without Databricks (using Power BI, Pandas, Tableau). Mechanism: Presigned URLs + Bearer Tokens. Constraint: Tabular data only (tables/views). Security: Can be restricted via IP filtering. D2D (The "Native" Path): Audience: Both parties are on Unity Catalog-enabled Databricks. Assets: Tables, Views, Volumes, Notebooks, and Models. Pros: No token management; Zero egress costs if in the same region. Performance: DBR 16.2+ uses scoped credentials, making it basically as fast as a local table read. Observations: The "Zero-Copy" aspect is the real winner here. The audit trail in system tables alone covers about 95% of standard compliance needs (GDPR/SOC). The Coastal Community Bank case study (2 months to 2 days for onboarding) seems to be the gold standard for ROI here. Discussion: Is anyone actually using the Open Sharing side with external vendors in production? How are you handling the token rotation/security for non-Databricks clients? Or are you finding that most of your partners are already on the Databricks ecosystem? submitted by /u/SalamanderOpen859 [link] [comments]
 News
Databricks and SAP: Building the Next Generation of Enterprise Data and Analytics
The Databricks and SAP partnership enables enterprises to securely share SAP data products directly into Databricks using delta sharing and native tools like Business Data Cloud. The video demonstrates a supply chain use case where Databricks agents use this integrated SAP data to automate predictive maintenance workflows and procurement actions.
Building A Data App with dashboard and agentic capabilities in dbx
Hi all, I’m currently working on a POC and im given the flexibility by my boss to explore using any tool (im considering mainly databricks or power apps now) to build out a “dynamic” data app to replace powerbi . I am fully aware that dbx ai/bi dash does not has nearly 100% capabilities of that the power bi dash but I’m just trying to showcase a different experience of reporting that leverages AI and not POWERBI (boring! to leaderships). For more context, im working with SAM/CMDB EoSL data that is all sitting in dbx unity catalog already. My expectations is something simple that looks like a dashboard but i can utilize genie to communicate pr generate any sql findings within the dashboard context. Something easy to initiate and maintain in the future. Additionally, it would also be best that the views created that caters to this app can be reused as native queries to powerbi in case the need in the future that id still have to migrate it there. End product expectations: The end product is expected to be easily accessible without any additional access required for any user that wants to access the app or genie. Think of leaderships and executives using the dash mainly. It should be something that is easy to access and managed within a workspace like what powerbi serves currently which is what all the stakeholders are currently used to already. I am no expert in Databricks but have been an active user for about a year now. All the best to everyone, cant wait to hear what you guys have in mind in the comments! (this is my first reddit post btw) submitted by /u/Junior-Confusion-691 [link] [comments]
PowerBI refresh disabled
Is Databricks Replacing Power BI and Tableau in the Enterprise?
Why did Databricks get into the BI tooling space & what does it mean for Databricks customers using Power BI, Tableau, and other established BI tools? In this 3-min video, David Meyer (SVP @ Databicks) shares how Databricks can help both provide advance decision making capabilities and lower costs, as well as where some of the older tools fit in your stack. This was recorded in front of a live audience at the Databricks Data + AI Summit 2026. Hope you enjoy it, and would personally love to hear your stories, both where AI/BI Dashboards from Databricks has been able to take on more of your BI workloads, as well where you still find gaps that need to be addressed! submitted by /u/JosueBogran [link] [comments]
Power BI Dataflow Gen1 → Databricks Pipeline: Is There a Migration Accelerator or Converter?
How to Migrate Power BI Semantic Models to Databricks Metric Views at Scale (Live Demo)
Hey everyone! In this demo that I recorded with David at Databricks, we show you one of the ways you can migrate semantic models from Power BI and into Databricks using a tool Databricks Labs calls "Kasal". Databricks does have some tooling built-in for migrations, but Kasal helps you do it at a much bigger scale. Hope you enjoy watching this, and that it helps you in your PBI migration efforts. Ultimately, it should be helping you save money on licensing costs from Power BI, consulting costs/labor from the migration efforts, and well, getting to production much faster. submitted by /u/JosueBogran [link] [comments]
Databricks metric views to PowerBI?
submitted by /u/FiftyShadesOfBlack [link] [comments]
Has anyone tried the new Databricks AI/BI feature?
I recently came across Databricks AI/BI and was curious to know how people are finding it. It looks like Databricks is trying to bring BI and analytics more directly into the Databricks platform, with dashboards and Genie for asking questions in natural language. Has anyone actually tried AI/BI in a real project? How is it compared to Power BI or Tableau from your experience? Is it good enough for regular BI use cases, or is it still better to use a separate BI tool? Would like to know your experience, especially if you have used both. submitted by /u/Bhanuprakash_1947 [link] [comments]
Harmonizing Informatica Governance Policies Across Databricks and Power BI Import Mode
Could Databricks app support the integration of Genei Room and Power BI?
Could Databricks app support the integration of Genei Room and Power BI?
Is it possible to embed a Genie Space inside a Power BI report?
Ingest image in databricks for powerbi ? a poc and any idea welcome
Spent some time this week on a POC that started from a business constraint: about 3,000 photos to ingest every week, sensitive enough that we can't just drop a shareable link in a dashboard, and they need to end up in Power BI where people already work, with row-level security. That combination rules out the easy answer. No public links, no loose files in blob storage floating around outside governance. The images had to live inside Delta on Databricks so Unity Catalog could handle access control, and Power BI had to be able to render them directly from the table. What the simple poc below does: Reads the images with Spark's binaryFile source (recursive lookup, glob filter on *.jpg) to pull path, modification time, size and raw bytes into one DataFrame. Encodes the binary content as a base64 data URL, so the image itself lives inside the row instead of behind a link. Then the actual blocker: Power BI caps text fields at roughly 32,766 characters, and a real photo's base64 string blows straight past that. So each string gets split into ~32,000-character segments and exploded into multiple rows, each tagged with its index and total length. On the Power BI side, a single DAX measure puts it back together in the right order before rendering: Image_concat = IF( HASONEVALUE(images_in_delta[image_name]), CONCATENATEX( images_in_delta, images_in_delta[segment], , images_in_delta[split_index] ) ) Not elegant, but it's what gets a full-resolution image through a hard platform limit without touching the sensitivity requirement. The PySpark side, stripped to what matters — reading the images and doing the chunking: from pyspark.sql import functions as F from pyspark.sql import DataFrame #READ ALL THE IMAGES images_df = spark.read.format("binaryFile") \ .option("recursiveFileLookup", "true") \ .option("pathGlobFilter", "*.jpg") \ .load("/Volumes/main/image_ingest/image_sample") def add_base64url_from_image_binary(df: DataFrame, max_len: int = 32000) -> DataFrame: df_with_b64 = df.select( "*", F.concat(F.lit("data:image/jpg;base64,"), F.base64(F.col("content"))).alias("base64url") ) df_with_split_info = df_with_b64.select( "*", F.ceil(F.length(F.col("base64url")) / F.lit(max_len)).cast("int").alias("num_segments"), F.length(F.col("base64url")).alias("total_length") ) df_split = ( df_with_split_info .withColumn( "split_index", F.explode(F.sequence(F.lit(0), F.col("num_segments") - 1)) ) .select( "*", F.substring( F.col("base64url"), F.col("split_index") * max_len + 1, F.least(F.lit(max_len), F.col("total_length") - F.col("split_index") * max_len) ).alias("segment") ) .drop("base64url", "content") ) return df_split def add_image_name(df : DataFrame) -> DataFrame : return df.withColumn("image_name", F.regexp_replace(F.col("path"),".*/([^/]+)$", "$1")) df_images = add_base64url_from_image_binary(images_df) df_images = add_image_name(df_images) df_images.write.mode("overwrite").format("delta") \ .option("mergeSchema", "true") \ .saveAsTable("main.image_ingest.images_in_delta") Nothing here is exotic engineering — the interesting part was realizing early that the constraint wasn't really "how do we store images in Delta," it was "how do we get a sensitive image through Power BI's text field limit without ever exposing it outside the governed table." Once that was clear, the chunking workaround fell out naturally. At 3,000 images a week this holds up. If volume goes up meaningfully, I'd want to revisit whether inlining every image is still the right call versus resolving binary content on demand. Curious if others have hit the same Power BI ceiling with sensitive image data and landed on something cleaner than manual chunking. Have you any other idea than this ? submitted by /u/Data-space_men [link] [comments]
Need to create scheduled PDF reports from Databricks and Postgres | NO Power BI
I need to create scheduled PDF reports my datasources are Databricks and Postgres. I know Power BI can do this but we don't want to go with it. What are the other options, cloud or on-premise? submitted by /u/Melodic_Hospital8274 [link] [comments]
Migrate PowerBI to databricks
Now we can drop the .pbit file to Genie Code and ask for migrating to databricks dashboard. I tested in direct query mode, and everything was migrated; I just had to be patient, as the whole process took quite a long time. The process created metrics views for tables used in Power BI, and now I understand why the dashboard relationship option was added. I presented how easy it is to migrate in my last video. https://www.youtube.com/watch?v=-e3tkcg21zw submitted by /u/hubert-dudek [link] [comments]
Databricks job trigger via SharePoint upload and possible write-back?
Hi there, Running into issues with this pipeline I'm working on. Still new to Databricks but coming from Power Automate, I seem to get the gist of databrick jobs. Anyway, my manager would love an automate workflow, where business users upload raw data to a central site (we're primarely using SharePoint), and want it cleaned and ready for our Power BI dashboards. Before databricks I handled it manually (by running local python code via VScode that sent the cleaned data to the SharePoint folders). What would be a good way to handle a pipeline like this? E.g. User uploads to sharepoint -> Databricks job -> writeback to sharepoint with cleaned data submitted by /u/Plus-Tear3283 [link] [comments]
Power BI dashboards using Direct Lake
Attach files in Genie Code
Genie Code is getting a new feature 🥳 Good news you can attach a document to Genie Code when you need it as temporary context for the current conversation. What's a good use case? 🔴 Explain or summarize a document: “Summarize this PDF and list the key decisions.” 🔴 Extract information from PDFs, scans, or images. 🔴 Generate code based on a specification: attach a requirements document and ask Genie Code to create Python or SQL. 🔴 Analyze data files such as CSV, Excel, JSON, or JSONL. 🔴 Convert documentation into code, tests, or a notebook. 🔴 Interpret diagrams, charts, architecture sketches, or screenshots. 🔴 Migrate Tableau or Power BI files into AI/BI dashboards using /importBI. What are the supported file types ? .pdf, .csv, .xlsx, .xls, .json, .jsonl, and common image formats. submitted by /u/Youssef_Mrini [link] [comments]
 News
Databricks News: ZeroOps, DABs, Indexes, Genie, sandboxes, migration from PowerBI, secrets
Zero Ops automatically detects errors in jobs and data quality with lineage analysis and proposes code fixes, while DABs now default to direct mode instead of Terraform with automatic state migration. Full-text search indexes deliver 400x faster queries on billion-row tables, Genie automatically converts PowerBI dashboards to Databricks metric views, and Unity Catalog secrets support granular read and reference-only permissions.
 Tutorials
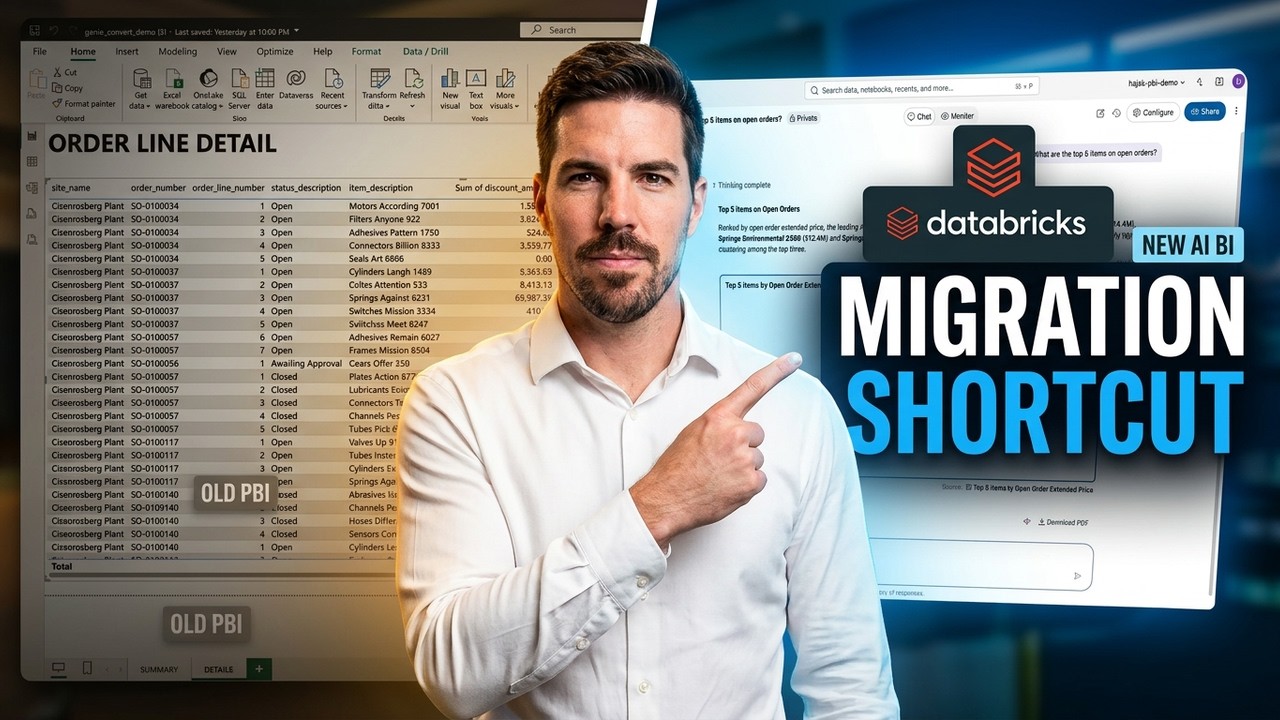
Power BI to AI BI: The Migration Shortcut You Need
The video demonstrates how to use Databricks Genie Code to automate the migration of Power BI report files into Databricks AI BI dashboards and semantic models. It walks through preparing a Power BI file, launching the import tool, generating the dashboard, and enabling an integrated Genie space for natural language data querying.
Power BI Refresh Fails with "Unable to Continue Fetch After Reconnect" from Azure Databricks
Metric Views with Power BI and Tabular Editor (Part 3 of 3)
Unifying Data and Governance in the Agentic Era: What’s New with Azure Databricks
Azure Databricks now offers new capabilities for unifying data and governance in the agentic era, including the industry's first true LTAP architecture, serverless Postgres database branching, and millisecond-level response times via Lakehouse//RT. These updates also bring Genie for Microsoft Teams and M365 Copilot, the new Azure Databricks Excel Add-in, and Azure Databricks CustomerLake, a lakehouse-embedded Agentic CDP.
Unlocking semantics for AI: How Mercedes-Benz Korea built trusted “Talk to Data” at scale
Mercedes-Benz Korea built a trusted "Talk to Data" solution at scale by making 500+ KPI definitions available in an AI-ready semantic layer on Unity Catalog metric views, accelerating the transition with an automated DAX-to-Metric-View transpiler. This governed semantic layer supports both existing BI and new "Talk to Data" experiences, with Genie and Agent Bricks providing consistent answers and shaping a playbook for persona-based AI agents across markets.
power BI mask function
[PARTNER BLOG] Building a Fully Automated Power BI Refresh Pipeline with Databricks
Data Science vs Data Analytics: Compare Careers, Skills, and Degrees
Data analytics explains what already happened using SQL and Power BI, while data science builds ML models to automate future decisions. Choosing between them depends on your appetite for technical depth, comfort with unstructured data, and preference for stakeholder communication vs. system deployment.
Query Tags: The Context Your Warehouse Queries Have Been Missing
Databricks SQL warehouses now support query tags, enabling cost attribution by team or project and automatic tagging for dbt, PowerBI, and Tableau. Tag queries from any source, including the SQL Editor, Notebooks, Dashboards, APIs, connectors, and drivers.
Power BI - DBX Unity catalog Lineage Syncer
Power BI/Tableau to Databricks the new way!
Have you noticed the new feature that allows for direct migration from Power BI/Tableau to Power BI using Genie Code? Currently it is a Beta feature. I took it for a spin and I am quite impressed to be honest. It took my semantic model and converted it to Metric Views 1:1. Except for a few DAX specific functions (which were flagged to me) everything was working the same way as in Power BI, including relations, measures etc. One thing I noticed is that Genie Code thought it should be able to convert the visual side as well, however it kept saying that there were no visuals in my exported .pbit file. \- I worked around it by including a screenshot, which it then rendered into the visuals correctly. [https://www.linkedin.com/feed/update/urn:li:activity:7464937157162541057/](https://www.linkedin.com/feed/update/urn:li:activity:7464937157162541057/) Anyone from Databricks that can give a heads up on that part - why does it not recognize the visuals from the file?
 News
Databricks News: watermark-based incremental ingestion, MCP in AI gateway, Genie, Vector Search
Databricks now offers watermark-based incremental ingestion from SQL databases without change data feed, allowing for efficient data updates and soft deletion handling. The AI Gateway supports custom MCP servers, enabling integration with external APIs like GitHub for enhanced AI application development.
 News
Rethinking Wireframing - Building Power BI Reports with Agents
The video demonstrates an AI-powered agent that generates Power BI reports from natural language prompts and user context, significantly accelerating the initial report design and build process. This tool aims to reduce the traditional lengthy wireframing and iteration cycles by quickly producing functional, multi-page Power BI reports.
 News
Synchronising Power BI to Metric Views with Tabular Editor's Semantic Bridge
Tabular Editor's new "Semantic Bridge" feature, launching in January, enables automatic synchronization of semantic models between Databricks Unity Catalog metric views and Power BI. This tool translates structural components and common SQL snippets into DAX, allowing users to maintain consistent business logic across different platforms.
 News
Data Triggers and Advanced Control Flow With Lakeflow Jobs
Databricks Lakeflow Jobs includes data triggers that automatically run pipelines when files arrive or tables update, ensuring jobs execute only when data is ready. Control flow features like for-each loops, conditionals, and repair-run enable building complex, modular pipelines with reduced costs and simpler debugging.
 News
Understanding Microsoft Fabric - Video 2
Microsoft Fabric is a browser-based interface within Power BI that consolidates Azure data services and Apache Spark to enable self-service creation of end-to-end data solutions with unified governance and data sharing. Fabric represents an evolution of Azure Synapse using Apache Spark and Delta Lake at its core, with pre-built templates called experiences designed to guide users through building complete integrated solutions rather than individual components.
 Tutorials
Microsoft Fabric: Tour of the User Interface
Microsoft Fabric organizes analytics tools into experiences (data engineering, data science, data warehouse) within workspaces, with lakehouses as core objects that combine Apache Spark data lakes and Delta table warehouses. Users can query lakehouses through multiple interfaces—Spark notebooks, T-SQL via SQL Analytics Endpoints, and Power BI—and must navigate contextual menus that change based on which component they're working with.
 Events
The Best Data Warehouse is a Lakehouse
Databricks SQL provides data warehousing capabilities on a lakehouse architecture, integrating core database features, governance, and business intelligence integrations. The platform utilizes AI systems to deliver automated query optimization, performance scaling, and built-in vector search functions.
 Tutorials
Streaming Data Analytics with Power BI and Databricks
The video demonstrates how to implement real-time streaming data analytics by combining Microsoft Power BI with Databricks lakehouse architectures. It details three specific scenarios using Delta live tables, structured streaming, direct query, composite models, and push APIs to build live reporting dashboards.
 News
Databricks SQL: Why the Best Serverless Data Warehouse is a Lakehouse
Databricks SQL is a serverless data warehouse built on the lake house architecture that unifies business intelligence and AI workloads. The video discusses the platform's core capabilities, including streaming tables, materialized views, workflows, intelligent workload management, and upcoming features like the Lakeview dashboarding experience.
 News
Real-Time Streaming Solution for Call Center Analytics: Business Challenges and Technical Enablement
Hitachi Solutions designed and implemented a real-time streaming data pipeline using Azure Databricks and Delta Live Tables to ingest call center metrics from Genesis Cloud. The solution successfully reduced data streaming latency to just seconds and displayed updated agent activity and queue metrics in Power BI dashboards.
 News
Sponsored: Matillion | Using Matillion to Boost Productivity w/ Lakehouse and your Full Data Stack
Matillion provides a visual data productivity platform built specifically for Databricks to accelerate pipeline creation and transformation. The demonstration shows how to connect data sources, build medallion architecture layers from bronze to gold, and execute Databricks notebooks within pipelines.
 News
How We Made a Unified Talent Solution Using Databricks Machine Learning, Fine-Tuned LLM & Dolly 2.0
Accenture built an AI-powered talent solution on Databricks using Delta Lake, MLflow, and over twenty-five machine learning models to assess workforce skills and labor market data. The platform incorporates a fine-tuned Dolly 2.0 language model integrated with LangChain to securely parse resumes and match candidates to roles.
 News
Sponsored by: Microsoft | Next-Level Analytics with Power BI and Databricks
This video demonstrates how to connect and query Databricks data within Power BI using various methods, including the Get Data interface, Partner Connect, custom SQL, and an upcoming direct publish feature. It also showcases Power BI's latest AI-powered capabilities, such as Co-pilot for report authoring and the Direct Lake mode for analyzing Delta parquet data without duplication.
 Tutorials
How To Use Databricks SQL for Analytics on Your Lakehouse
Databricks SQL provides serverless compute, a familiar query editor, and built-in governance to support analytics workflows on a lakehouse. The demonstration shows how to connect business intelligence tools like Tableau to Databricks SQL and configure queries, dashboards, and alerts.
 News
Predicting Repeat Admissions to Substance Abuse Treatment with Machine Learning
This video demonstrates a machine learning model that predicts repeat admissions for substance abuse treatment using publicly available data from SAMHSA. It showcases a Power BI dashboard utilizing model explainers to help clinicians personalize patient treatment and reduce readmission rates.
Get Tuesday's version of this
Tracking Power BI? The Tuesday email carries what moved across the whole ecosystem, not just this topic. Free, one-click unsubscribe.