Data Quality
Recent items mentioning Data Quality across the Databricks ecosystem — releases, news, videos, and community Q&A. Updated hourly.
Data quality is increasingly recognized as foundational for AI strategy, with a recent blog post declaring it "the AI strategy" itself, emphasizing fixes to transactional systems and unified data for value creation 3. Practitioners are actively seeking guidance on integrating data quality tests 6 and building data quality monitors on Databricks Apps 5. Furthermore, data quality and observability are highlighted as critical components in mastering data engineering system design interviews 1.
Generated daily from the 7 most recent items mentioning Data Quality. Click any [N] to jump to the source.
CommunityHow I Mastered System Design Interviews
This video teaches a six-step framework for mastering data engineering system design interviews, covering requirements gathering, pipeline design, data modeling, storage and file formats, data quality and observability, and pipeline resilience. It demonstrates how to apply this framework with practical examples and back-of-the-envelope calculations to justify design choices.
NewsData + AI Executive Series: Fast 5 — Scaling Real-Time Ops with Databricks at Aer Lingus
Aer Lingus uses Databricks to scale real-time operations, particularly for making critical decisions in their operation control center regarding flight delays and cancellations. They are also exploring using "Agentic" to automate business case creation and review, aiming for a single, governed platform for reusable agents.
Data quality is the AI strategy
Your AI strategy hinges on data quality, starting with fixes to transactional systems. Organizations prioritizing value creation with unified data will benefit most, as tools and models constantly evolve.
The next generation of Databricks Genie just launched. Here is what data engineers actually need to know.
I have been following Genie since it first launched with AI/BI last year. Back then, I honestly thought it was mostly for business users. A chatbot on top of your data that could answer basic questions in plain English. Useful, but not something I thought data engineers really needed to care much about. After seeing the new 2026 version, I completely changed my mind. Genie is no longer just a business chatbot. The biggest change is Genie Code, which is basically an AI agent designed for data professionals. It can generate pipelines, debug failures, create dashboards, monitor systems, and work directly with Lakeflow and Unity Catalog. That part caught my attention immediately because it moves beyond simple Q&A and starts touching actual engineering workflows. What surprised me most is how connected the whole system has become. It can pull context from dashboards, Genie Spaces, apps, metadata, documentation, and external systems like GitHub, Jira, and Confluence through MCP. Instead of only searching tables, it tries to understand relationships across the environment. That feels very different from the first version. The operational side is also interesting. Genie Code can monitor pipelines, investigate failures, help with DBR upgrades, and respond to issues before teams even notice them. The more I read about it, the more it felt less like a chatbot and more like an assistant sitting beside the engineering team. But honestly, the biggest takeaway for me is not the AI itself. It is what this means for data engineers. A lot of people immediately jump to “AI will replace data engineers,” but I think the opposite is happening. These systems are only as good as the data foundation underneath them. If metadata is incomplete, if tables are messy, if naming conventions are inconsistent, or if documentation is missing, the AI layer will give poor answers confidently. That means clean data modeling, governance, metadata, documentation, and data quality are becoming even more important than before. The engineers building those foundations become more valuable, not less. I think the role is slowly shifting away from spending hours writing repetitive boilerplate transformations and more toward building trustworthy, AI-ready data systems. One thing I keep noticing while learning Databricks through BricksNotes and the wider community is that the platform is moving very quickly toward AI-native data engineering. Features like Unity Catalog, Lakeflow, and now Genie all connect together. It feels like understanding metadata and governance is becoming just as important as understanding Spark itself. Also interesting that Genie now has a full mobile experience on iOS and Android. Business users can access dashboards, apps, and chat directly from their phones, which means the underlying data quality matters even more because people are going to depend on these systems everywhere, not only during work hours. Curious if anyone here is already using Genie or Genie Code in production. I would genuinely like to hear how the answer quality has been and whether your teams are changing how they approach metadata and documentation because of it.
Three MCPs, One Answer: Building a Data Quality Monitor on Databricks Apps
Tips for integrating data quality tests?
I've been brought on as a data engineering consultant for a small to mid-sized company who has a poorly built architecture in Databricks. There's currently no documentation or clear architecture, so I've been spending weeks trying to untangle everything. They now want me to start implementing data quality checks because as of now there's no testing within the process at all and they're unsure if their outputs are even correct. Currently the data they want me to test are just raw files uploaded into Databricks tables on an irregular schedule, all with different granularity and logic that will require more complex checks than just null checks and unique primary keys. What is the best starting point for this? They have jobs and jobs that run jobs but no pipelines established, and I don't think I have the power to change that yet, so I think that takes DLT off the table unless I can prove it's worth the refactor. My first thought was integrating pyspark testing scripts to run within the jobs, but there has to be a more sophisticated way to do this?
The learning order that actually works for Databricks. I wasted 3 months before figuring this out.
I want to share something that I wish someone told me when I started learning Databricks because it would have saved me months of confusion. When I first opened Databricks, I did what most people do. I went straight to PySpark because every tutorial said that is what data engineers use. I spent weeks trying to understand RDDs, DataFrames, transformations, actions, lazy evaluation, and the DAG all at once. I could follow along with the instructor but the moment I opened a blank notebook I had no idea where to start. Then I took a step back and tried something different. I started with SQL. Databricks runs SQL natively. I already knew SQL from a previous job. Within an hour I was querying tables, running aggregations, building views. I felt productive for the first time in weeks. That confidence changed everything. Here is the order that worked for me and I genuinely believe it works for most people. Start with SQL on existing tables. Databricks has sample datasets built in. Run SELECT statements. Do GROUP BY. Write JOINs. Get comfortable navigating data. If you already know SQL from any database this stage takes a few days not weeks. Then learn Delta Lake through SQL. Create tables. Insert data. Update rows. Delete rows. Run DESCRIBE HISTORY and see the transaction log. Run SELECT VERSION AS OF and experience time travel. This is where Databricks starts to feel different from other databases. Every table you create is automatically a Delta table so you get versioning, schema enforcement, and ACID transactions without configuring anything. Then move to PySpark DataFrames. Now that you understand what the data looks like and how Delta tables work, PySpark makes way more sense. You understand what df.filter does because you already did WHERE in SQL. You understand what df.groupBy does because you already did GROUP BY. Lazy evaluation clicks faster because you have context for what the transformations are actually doing. Then build pipelines. Take what you learned and chain it together. Read from a source. Transform. Write to a Delta table. Schedule it. Monitor it. This is where Lakeflow (the new name for Delta Live Tables) comes in. But it makes no sense if you skip the previous steps. Then governance. Unity Catalog, permissions, data quality expectations. This feels like admin work when you learn it in isolation but once you have built a pipeline you understand exactly why it matters. The mistake I made was trying to learn PySpark before I understood the data model. I was writing code without knowing what it produced. Once I started with SQL and built up from there everything fell into place faster. One more thing. If you are on Free Edition you do not need to configure clusters. It is serverless. If a tutorial tells you to create a cluster and choose a runtime version that tutorial was written for Community Edition which no longer exists. Just open a notebook and start writing code. Hope this helps someone who is feeling overwhelmed right now. Happy to answer any questions in the comments.
cant apend results of streaming group by agregations
Hi, I'm relatively new to Databricks. I have a medallion architecture with the following components: \- cor\_project (catalog) \- bronze (schema) \- raw\_swell\_metrics (table) \- data (volume) \- landing \- checkpoints \- raw\_swell\_metrics \- silver (schema) \- swell\_metrics (table) \- quarantine\_swell\_metrics (table) \- data (volume) \- checkpoints \- swell\_metrics \- quarantine\_swell\_metrics \- gold (schema) \- wave\_daily\_summary (table) \- data (volume) \- checkpoints \- wave\_daily\_summary The flow is as follows: Add file(s) to bronze.data.landing -> manually execute job -> read only new file(s) and add them to bronze.raw\_swell\_metrics -> read only new rows in bronze.raw\_swell\_metrics (transform and data quality) and add them to swell\_metrics or quarantine\_swell\_metrics -> read only new rows in silver.swell\_metrics (transform) and add them to gold.wave\_daily\_summary. The data is uploaded every month with a new file. The data is flowing correctly from landing to silver.swell\_metrics It fails when I'm transforming it to gold. Code: df_silver_swell_metrics = ( spark.readStream .format("delta") .table(f"cor_project.silver.swell_metrics") ) df_silver_swell_metrics_transformed = ( df_silver_swell_metrics .groupBy( F.date_trunc("day", "datetime").alias("day"), "coast_name" ).agg( F.max("wave_height_m").alias("max_wave_height_m"), F.expr("max_by(wave_period_s, wave_height_m)").alias("max_wave_period_s"), F.expr("max_by(wave_direction_deg, wave_height_m)").alias("max_wave_direction_deg"), F.expr("max_by(wind_speed_ms, wave_height_m)").alias("max_wave_wind_speed_ms"), F.expr("max_by(wind_direction_deg, wave_height_m)").alias("max_wave_wind_direction_deg"), F.min("wave_height_m").alias("min_wave_height_m"), F.expr("min_by(wave_period_s, wave_height_m)").alias("min_wave_period_s"), F.expr("min_by(wave_direction_deg, wave_height_m)").alias("min_wave_direction_deg"), F.expr("min_by(wind_speed_ms, wave_height_m)").alias("min_wave_wind_speed_ms"), F.expr("min_by(wind_direction_deg, wave_height_m)").alias("min_wave_wind_direction_deg"), F.avg("wave_height_m").alias("avg_wave_height_m") ) ) df_gold_wave_daily_summary = ( df_silver_swell_metrics_transformed .select( F.col("day").alias("date"), F.col("coast_name"), F.col("max_wave_height_m").cast("float"), F.col("max_wave_period_s").cast("float"), F.col("max_wave_direction_deg").cast("float"), F.col("max_wave_wind_speed_ms").cast("float"), F.col("max_wave_wind_direction_deg").cast("float"), F.col("min_wave_height_m").cast("float"), F.col("min_wave_period_s").cast("float"), F.col("min_wave_direction_deg").cast("float"), F.col("min_wave_wind_speed_ms").cast("float"), F.col("min_wave_wind_direction_deg").cast("float"), F.col("avg_wave_height_m").cast("float") ) ) ( df_gold_wave_daily_summary.writeStream .format("delta") .trigger(availableNow=True) .option("checkpointLocation", f"/Volumes/cor_{ambiente}/gold/data/checkpoints/wave_daily_summary") .toTable(f"cor_project.gold.wave_daily_summary") ) This generates the following error: [STREAMING_OUTPUT_MODE.UNSUPPORTED_OPERATION] Invalid streaming output mode: append. This output mode is not supported for streaming aggregations without watermark on streaming DataFrames/DataSets. SQLSTATE: 42KDE I have tried including F.watermark it works, but doesn't load the records for the last day. Any idea how to solve it? Thanks for any advice
How do you reframe data engineering for a CEO who thinks it's "data quality oversight"?
Effective strategies to enhance data quality management
Improve data quality with testing, metrics, automation, and a scalable governance framework.
How data transformation improves data quality and analysis
Learn how transformation methods improve data quality, consistency, and analysis at scale with dbt.
Effective strategies to improve data quality across your organization
Databricks practitioners can improve data quality with proven strategies for testing, governance, and scalable analytics workflows. Learn how to implement these effective strategies across your organization.
NewsOpenClaw, Databricks Agentic Data Monitoring & more! | AI Newsround - February 2026 | Advancing AI
The video discusses OpenClaw, an open-source framework for AI agents, and Databricks' new agentic data quality monitoring solution. It also introduces Advancing Analytics' Lake Forge and Pantheon, a framework and AI layer for developing scalable Lake Flow pipelines, and highlights new model releases from Anthropic, Google, and OpenAI.
NewsDatabricks Breaking News: 2026 Week 6: 2 February 2026 to 8 February 2026
Databricks introduces agentic data quality monitoring with anomaly detection, LLM judge UI builder for MLflow, and new SQL warehouse features including a default option and activity details. The platform also enhances its assistant to connect with MCP servers, improves Google Sheets integration with pivot table functionality, and adds direct Git deployment and tagging for Databricks apps.
NewsLakeflow Connect: Smarter, Simpler File Ingestion With the Next Generation of Auto Loader
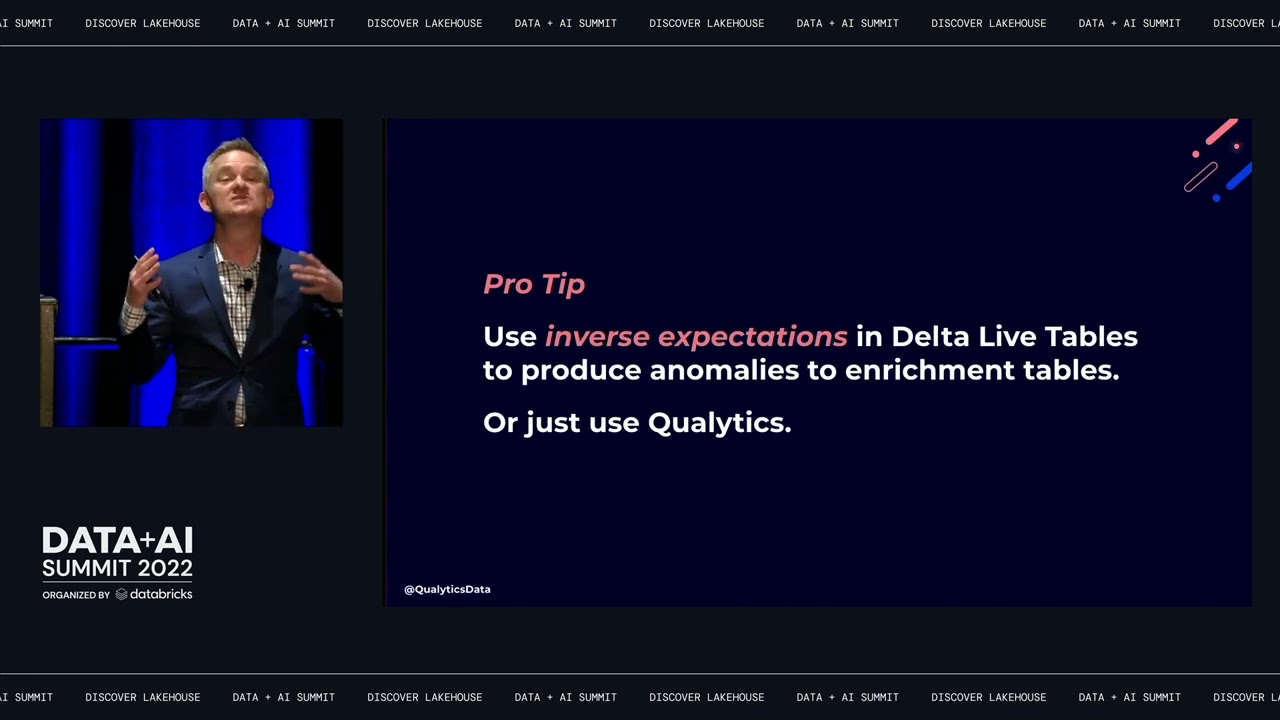
News125. Databricks | Pyspark| Delta Live Table: Data Quality Check - Expect
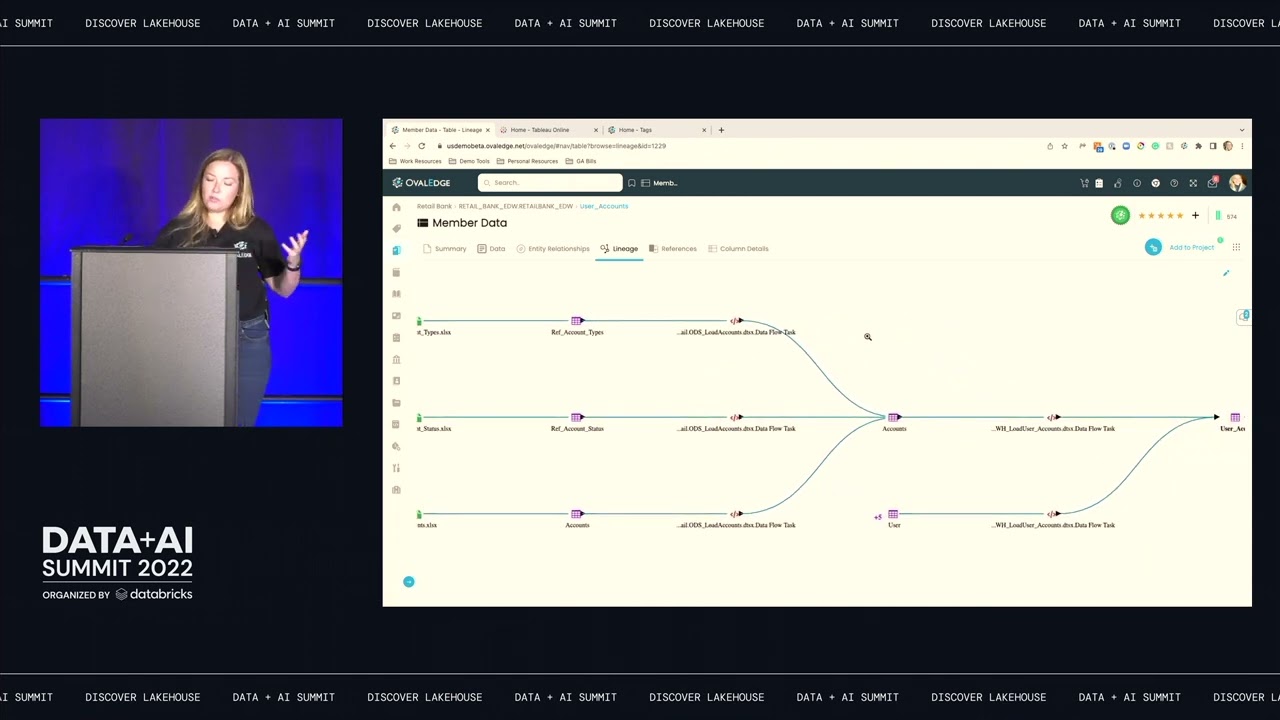
NewsIncreasing Data Trust: Enabling Data Governance on Databricks Using Unity Catalog & ML-Driven MDM
NewsLeveraging IoT Data at Scale to Mitigate Global Water Risks Using Apache Spark™ Streaming and Delta
NewsUS Army Corp of Engineers Enhanced Commerce & National Sec Through Data-Driven Geospatial Insight
NewsSponsored: Matillion | Using Matillion to Boost Productivity w/ Lakehouse and your Full Data Stack
CommunitySponsored by: Fivetran | Fivetran and Catalyst Enable Businesses & Solve Critical Market Challenges
NewsSponsored by: Anomalo | Scaling Data Quality with Unsupervised Machine Learning Methods
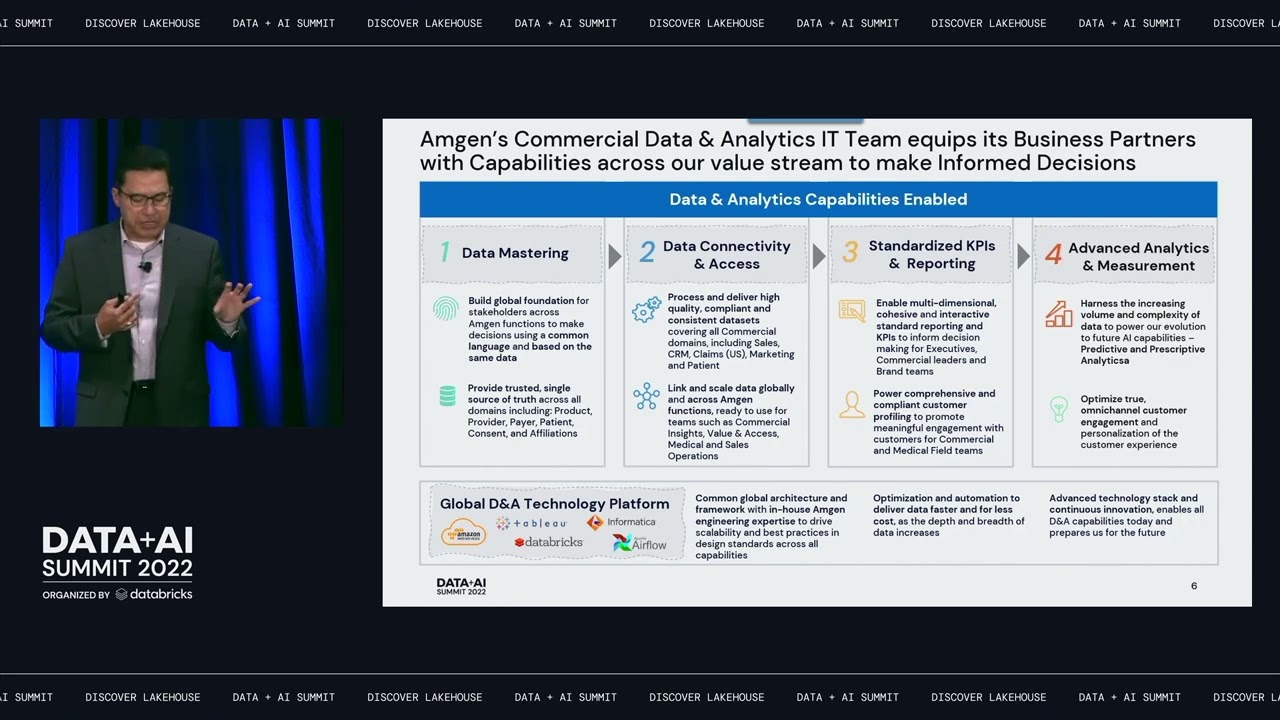
NewsSponsored: Accenture | Databricks Enables Employee Data Domain to Align People w/ Business Outcomes
NewsHow unsupervised machine learning can scale data quality monitoring in Databricks
News


